Hi guy,
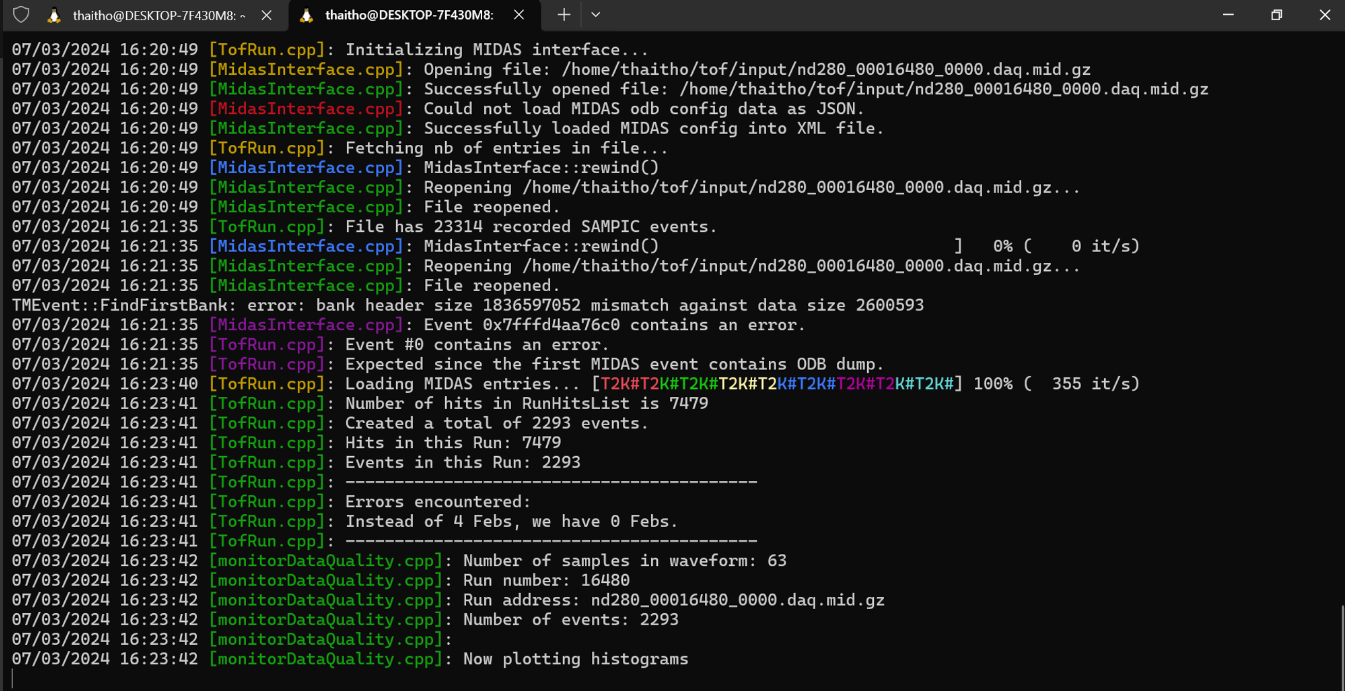
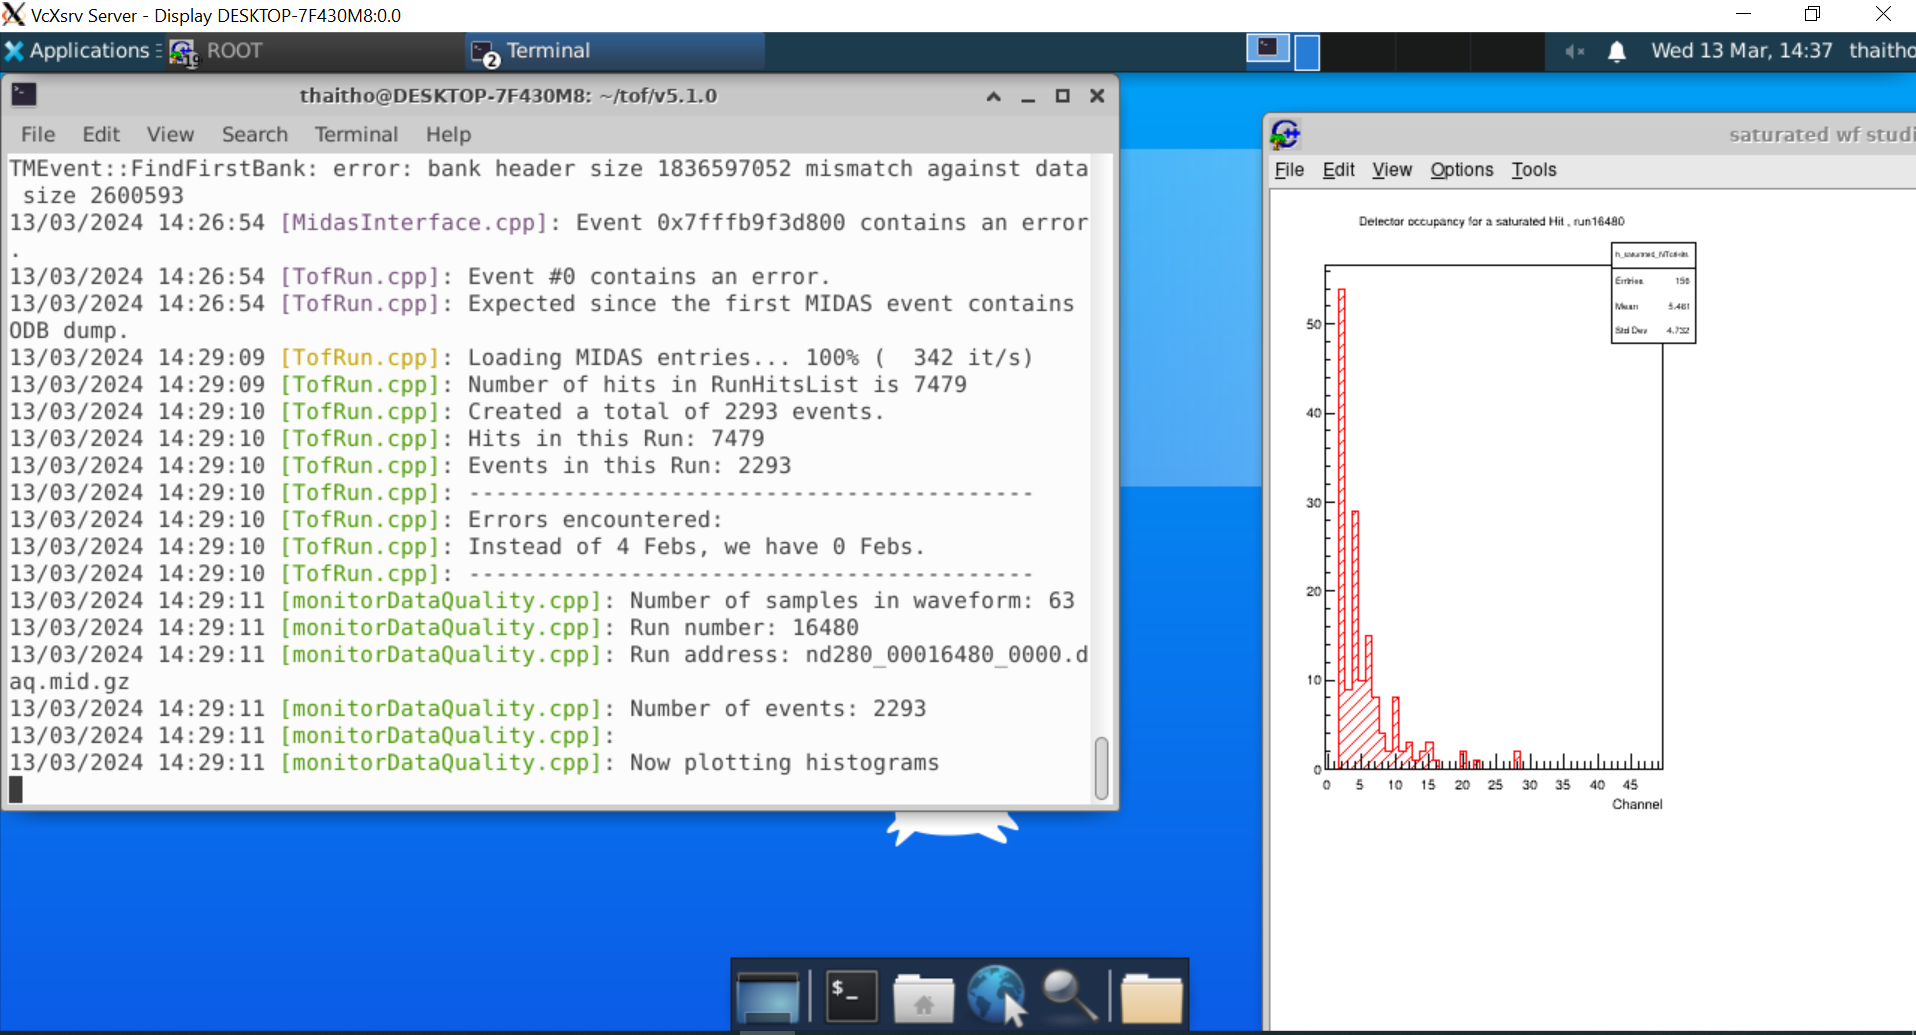
I ran a data collection program and the output I have a histogram with ROOT. I can save the histogram and open it. But the histogram is not displayed automatically. Any ideas why or how to solve this?
Hi guy,
I ran a data collection program and the output I have a histogram with ROOT. I can save the histogram and open it. But the histogram is not displayed automatically. Any ideas why or how to solve this?
Hello,
Welcome to the ROOT community!
It’s hard to figure out from the context given what is really happening. Allow me a follow up question…
Are you drawing the histogram? How?
Cheers,
D
So you are running linux on Windows (WSL)? Check this, maybe it helps:
Oh Thank dastudillo, I did it but it was like adding another virtual machine. Sorry, but can you explain more clearly to me? I’m just a student
In which OS are you running ROOT? and how are you running it, exactly?
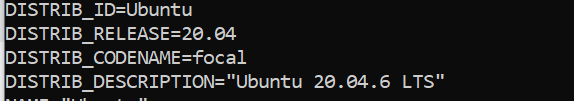
How are you running linux (and what linux distro)? Is this a virtual machine on Windows (Vmware? virtualbox? other?), or WSL?
If it’s a virtual machine, you should not need an Xserver on Windows --of course, your linux distro should have its own desktop environment (like XFCE) if you want graphics like this, but this is independent of Windows.
If it’s WSL, I don’t know if it’s a very good idea to run xfce or any desktop environment like that; I’d just run the terminal and the Xserver on Windows for the ROOT graphical stuff. For a full graphical environment, I think a virtual machine is perhaps a better option (other than dual booting to a “real” linux ![]() ). But again, this is just me; if it works for you, and you are happy with it, why not
). But again, this is just me; if it works for you, and you are happy with it, why not ![]()
this my linux distro and WSL ![]()