Hi,
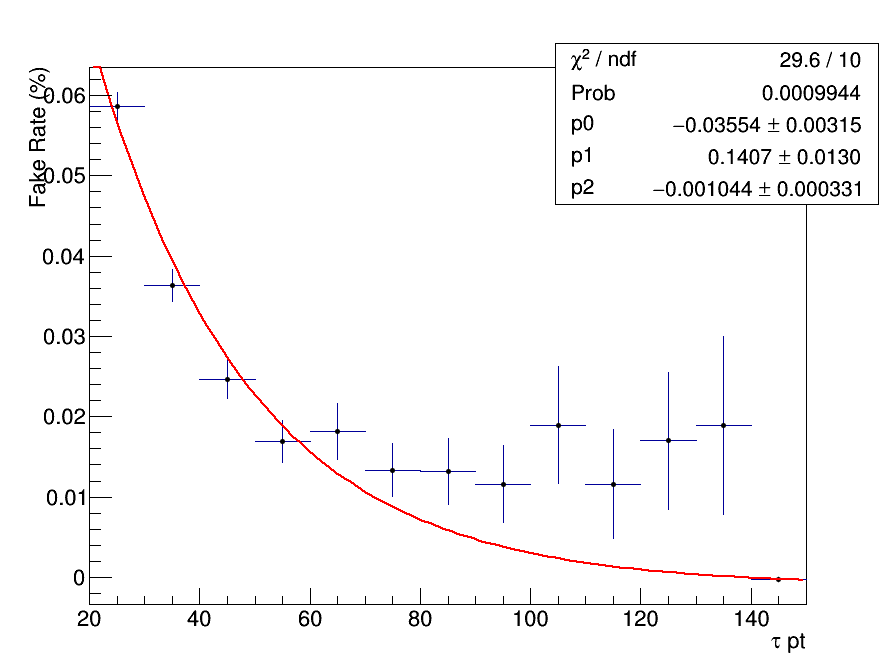
I am trying to fit some distribution where the chisuare/ndf value is around 3 but probability value is very small (0.0009944) if I change the parameter value probability value is .98 but chisquare/ndf value becomes worse, it is 2/9. I know for fitting I should look at the chisquare/ndf value which should be around 1 but does one need to check the probability value also?
Thanks,
S
Hi,
the value of the probability (p-value) is also important, the p-value if you are fitting the data with with the function they come from should be uniformly distributed between 0 and 1, otherwise the p-value distribution
is distorted and gives p-value close to zero. Usually p-value to small indicate not agreement between data and the fitting function.
In any case have a look at Chi-Square distribution
Hi Dilicus,
Thanks, for your reply. I know if p value is very small, data is not compatible with function used to fit. But while fitting the distribution in root, the probability value shown with the parameter values are same with the p value which gives the probability of obtaining the observed value or more that that?
Thanks,
S
Hi @saswatinandan ,
sorry for the late answer. The probability in root is equal to p-value.
So is the integral of the chisquare with k degree of freedom from the chi square value you obtain to infinity.
Cheers,
Stefano
Hi Dilicus,
Thanks for making the things clear. I want to fit some distributions, I have tried changing the range of parameter values but it didn’t help to get the reasonable value of p or chi2/ndf. i have attached the plots, could you give me some suggestions? I used the following function to fit
f(pt) = [2]+[1]*Exp([0]*pt)
Hi,
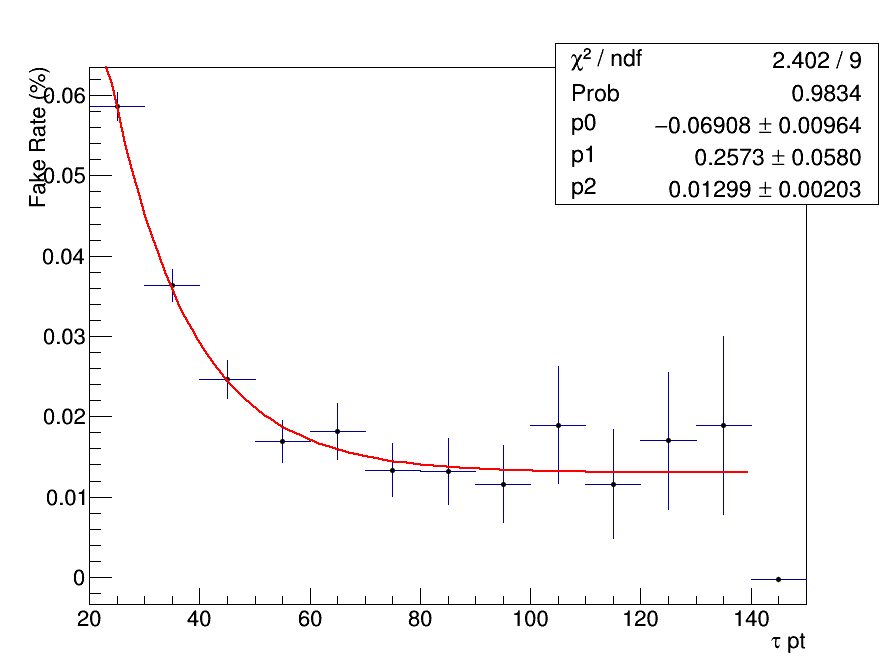
the second one seems better to me and the chi2/ndf small is only due to the large error on the y of the last few points. For sure the last point influence a lot the fit.
Cheers,
Stefano
Hi Dilicus,
Yes, the last point has a great influence, that’s why I excluded that point in the last plot. I don’t know whether there is any other function which can give the better value.
Thanks,
S
I don’t know maybe you can use
[0]*ROOT::Math::normal_cdf_c (pt, sigma,mu) + [1]
Is the only function I can think of, basically is the cumulative from x to infinity of a gaussian with mean mu and variance sigma square.
In this way the sigma can account also for the resolution of the pt variable.
Cheers,
Stefano