Hi,
ok I do understand your concern.
in principle you would have to log the z-axis. But this will have no effect on the violin charts at the moment.
I will put that on my list :-),
Anyhow before this is going to work I also have to implement a possibility for a correct scaling of the violin charts. At the moment the histo-slices (that what you call the blue lines) are all scaled to each max-bin of each histo-slice, So histo-slices with different max-bin entries per slice should have different scales, but they aren’t currently.
A current workaround for you is to change the example you showed by using the following lines of code (please be aware that correct scaling is still not done):
void candledecay()
{
   TCanvas *c1 = new TCanvas("c1","Candle Decay",800,600);
   c1->Divide(2,1);
   TRandom *rand = new TRandom();
   TH2D *h1 = new TH2D("h1","Decay",1000,0,1000,20,0,20);

   float myRand;
   for (int i = 0; i < 17; i++) {
      for (int j = 0; j < 1000000; j++) {
         myRand = rand->Gaus(350+i*5,5+5*i);
         h1->Fill(myRand,i);
      }
   }
   h1->SetBarWidth(4);
   h1->SetFillStyle(0);
   h1->SetFillColor(kGray);
   h1->SetLineColor(kBlue);
   h1->GetYaxis()->SetTitle("time");
   h1->GetXaxis()->SetTitle("probability density");

   for (int x = 1; x <= h1->GetNbinsX(); ++x) {
	   for (int y = 1; y <= h1->GetNbinsY(); ++y) {
		   float myBin = h1->GetBinContent(x,y);
		   if (myBin > 0) h1->SetBinContent(x,y,TMath::Log10(myBin));
	   }
   }


   c1->cd(1);
   h1->Draw("violiny(12000000)");
   c1->cd(2);
   TH2I *h2 = (TH2I*)h1->Clone("h2");
   h2->SetBarWidth(0.8);
   h2->DrawCopy("candley2");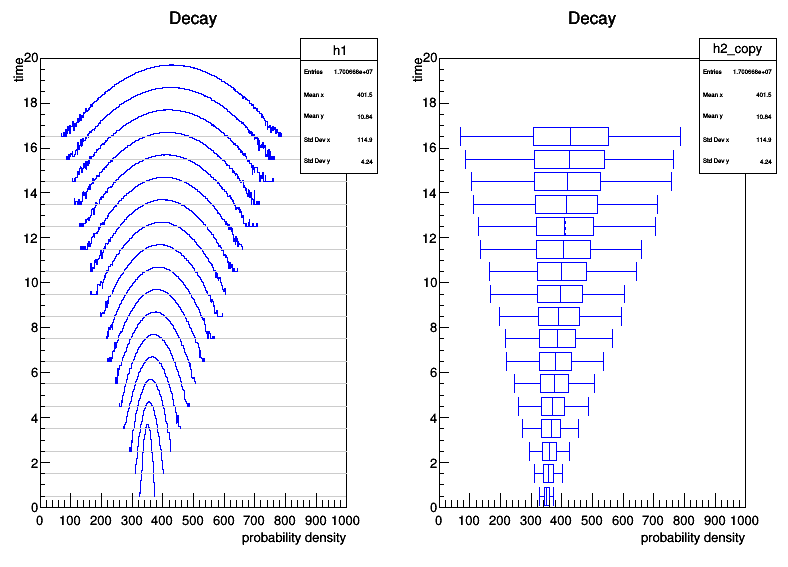
Georg