Dear Experts
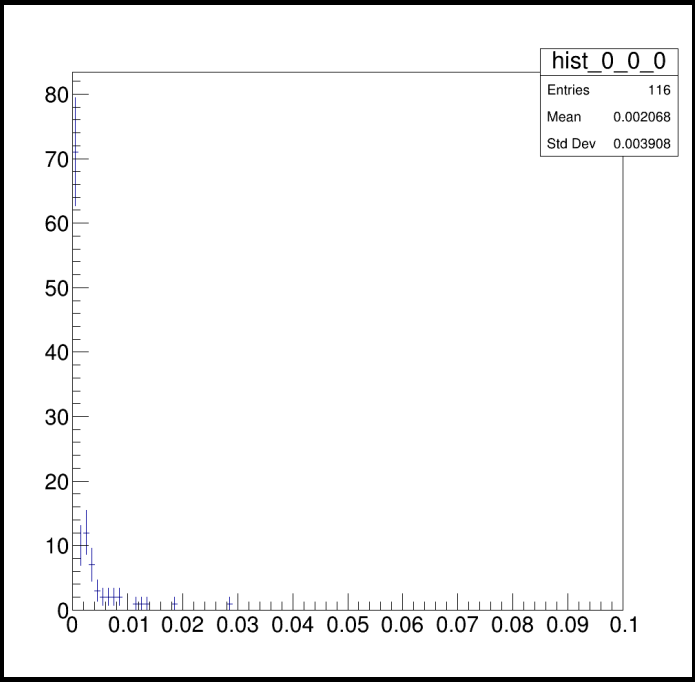
Below is my Code and I am studying the Energy deposition in the hottest bin and the neighboring bins but my Entries are very less. Am I considering all the Events? As An Example I have uploaded one histogram of hottest bin While In order to visualize I am also uploading projection. Once can see that central bin is very dense and contains lot of entries.
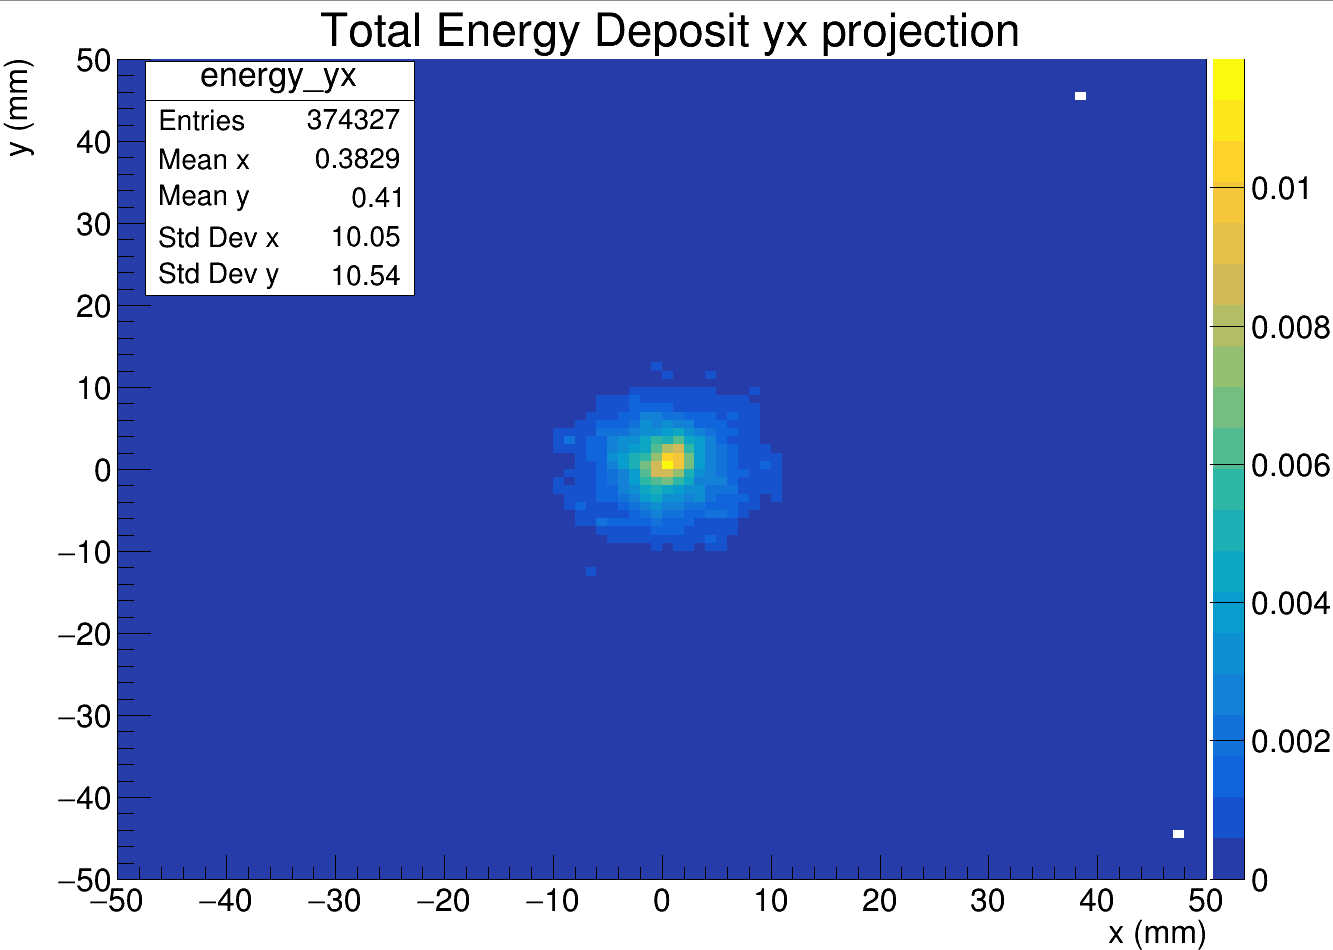
My Code run for 1000 events
#include <iostream>
#include <iomanip>
#include <sstream>
#include <fstream>
#include <string>
#include <vector>
#include <map>
#include <stdlib.h>

#include "TROOT.h"
#include "TTree.h"
#include "TChain.h"
#include "TFile.h"
#include "TString.h"
#include "TSystem.h"
#include "TCanvas.h"
#include "TLegend.h"
#include "TH1.h"
#include "TH2.h"
#include "TH3.h"
#include "TColor.h"
#include "Riostream.h"
#include "TDatime.h"
#include "TMath.h"
#include "TStyle.h"
#include "TLorentzVector.h"

#include <TTreeReader.h>
#include <TTreeReaderValue.h>
#include <TTreeReaderArray.h>


stringstream ss;

void cell()
{
    // *************************************************************************
    // Rootfile and Tree
    TFile* f = new TFile("lumidet_PbWO4.edm4hep.root");
    f->cd();

    //TTree* t = (TTree*)f->Get("events");
    TTreeReader myReader("events", f);                     // name of tree and file

    TTreeReaderArray<Float_t> energy(myReader, "LumiDirectPCALHits.energy");
    TTreeReaderArray<Float_t> x(myReader, "LumiDirectPCALHits.position.x");
    TTreeReaderArray<Float_t> y(myReader, "LumiDirectPCALHits.position.y");
    TTreeReaderArray<Float_t> z(myReader, "LumiDirectPCALHits.position.z");
    // Rootfile and Tree
    // *************************************************************************


    // *************************************************************************
    // Histograms
    map<string,TH1*> h1;
    map<string,TH2*> h2;
    map<string,TH3*> h3;

    float xmin = -50 - 0.5;
    float xmax = 50 + 0.5;
    int nx = 100 + 1;
    float ymin = -50 - 0.5;
    float ymax = 50 + 0.5;
    int ny = 100 + 1;
    float zmin = 66000 - 0.5;
    float zmax = 66300 + 0.5;
    int nz = 300 + 1;

    // 3D histogram x, y, z. total energy deposit as T axis
    h3["energy"] = new TH3F("energy", "Total Energy Deposit;x;y;z", nx, xmin, xmax, ny, ymin, ymax, nz, 0, zmax - zmin);

    // Histograms
    // *************************************************************************


    // *************************************************************************
    // Event Loop
    // The first for loop to fill 3D histogram
   // int nev_max = 10000;
    int nev = 0;
    while (myReader.Next())
    {
       // if (nev >= nev_max) break;
        nev++;
       // if (nev % 100 == 0) cout << "Event: " << nev << endl;

        float tot_e = 0;
        for (int i = 0; i < energy.GetSize(); i++)
        {
            tot_e += energy[i];
            float z_shifted = abs(z[i]) - zmin;
            h3["energy"]->Fill(x[i],y[i],z_shifted,energy[i]);
        }
    }
    // Event Loop
    // *************************************************************************


    // *************************************************************************
    // Identify Max Energy Bin
    float e_max = 0;
    float x_max = -999;
    float y_max = -999;
    float z_max = -999;
    for (int ix = 1; ix <= h3["energy"]->GetNbinsX(); ix++)
    {
        for (int iy = 1; iy <= h3["energy"]->GetNbinsY(); iy++)
        {
            for (int iz = 1; iz <= h3["energy"]->GetNbinsZ(); iz++)
            {
                if (h3["energy"]->GetBinContent(ix,iy,iz) > e_max)
                {
                    e_max = h3["energy"]->GetBinContent(ix,iy,iz);
                    x_max = h3["energy"]->GetXaxis()->GetBinCenter(ix);
                    y_max = h3["energy"]->GetYaxis()->GetBinCenter(iy);
                    z_max = h3["energy"]->GetZaxis()->GetBinCenter(iz);
                }
            }
        }
    }
    cout << "max-E : " << e_max << endl;
    cout << "max-X : " << x_max << endl;
    cout << "max-Y : " << y_max << endl;
    cout << "max-Z : " << z_max << endl;

    // Identify Max Energy Bin
    // *************************************************************************

    // *************************************************************************
    // Plot Energy spectrum of the max bin
    // 27 X 1D histograms around and of the bin with the max energy deposit
    map<vector<int>,TH1*> h1max;
    for (int ix = -1; ix <= 1; ix++)
    {
        for (int iy = -1; iy <= 1; iy++)
        {
            for (int iz = -1; iz <= 1; iz++)
            {
                ss.str(""); ss << "hist_" << ix << "_" << iy << "_" << iz;
                vector<int> v = {ix,iy,iz};
                h1max[v] = new TH1F(TString(ss.str()), "", 100, 0, 0.1);
            }
        }
    }


    // *************************************************************************
    // Loop again
    myReader.Restart();
    nev = 0;
    while (myReader.Next())
    {
       // if (nev >= nev_max) break;
        nev++;
        //if (nev % 100 == 0) cout << "Event: " << nev << endl;

        for (int i = 0; i < energy.GetSize(); i++)
        {
            int ix = x[i] - x_max;
            int iy = y[i] - y_max;
            float z_shifted = abs(z[i]) - zmin;
            int iz = z_shifted - z_max;
           // cout << nev << " " << i << " " << ix << " " << iy << " " << iz << endl;
            if (abs(ix) > 1 || abs(iy) > 1 || abs(iz) > 1) continue;

            cout << ix << endl;
            vector<int> v = {ix, iy, iz};
            h1max[v]->Fill(energy[i]);
        }
    }
    // Loop again
    // *************************************************************************


    for (map<vector<int>, TH1*>::const_iterator itr = h1max.begin(); itr != h1max.end(); itr++)
    {
        int ix = itr->first[0];
        int iy = itr->first[1];
        int iz = itr->first[2];
        TCanvas* c = new TCanvas("c", "", 1000, 1000);
        c->cd();
        itr->second->Draw("");

        ss.str(""); ss << "test_" << ix << "_" << iy << "_" << iz << ".png";
        c->SaveAs(TString(ss.str()));
        c->Close();
    }