Hi,all.
I am fitting a TGraph with user-Defined Functions (TF1).
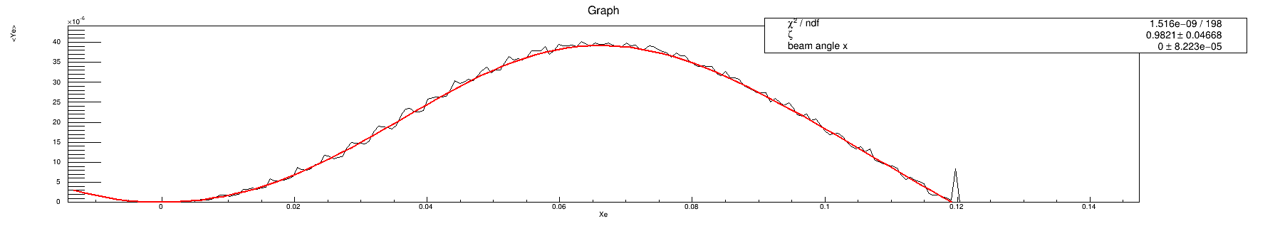
I am getting exceptionally large vales for chi2/NDF and I am confused, since the data fits the curve almost perfectly(see the plot).
The result is fit option "E"
The result is fit option"R"
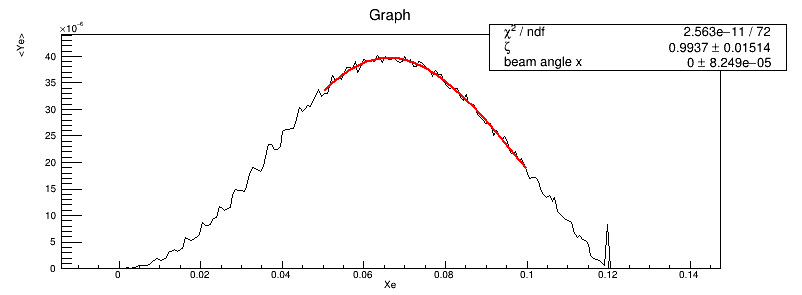

I think the fit result is perfect from the figure. And the fit result shows the fit parameter(0.9937) is close to true value(equal to 1). But the only thing I don’t understand is that chi2/NDF is very large.
#include "TCanvas.h"
#include "TFrame.h"
#include "TBenchmark.h"
#include "TString.h"
#include "TF2.h"
#include "TH2.h"
#include "TFile.h"
#include "TROOT.h"
#include "TError.h"
#include "TInterpreter.h"
#include "TSystem.h"
#include "TPaveText.h"


   //Define the fit fucntion Pai(y)
	 Double_t fitf(Double_t *x, Double_t *par)
	 {

	                double Ee = 45.5*1e9;
			double w0 = 1.24;
			double me = 0.511*1e6;
			double kappa = 4*Ee*w0/(me*me);
			double gamma = Ee/me;
			double L1 = 60;
			double L2 = 40;
			double theta0 = 3.4467*1e-3;
      			double xx = (x[0]-par[1]*L1-kappa/2*theta0*L2)/(kappa/2*TMath::Sqrt(L1*L1/gamma/gamma+theta0*theta0*L2*L2));
			double n = kappa/2;
			double m = theta0*L2/TMath::Sqrt(L1*L1/gamma/gamma+theta0*theta0*L2*L2)*kappa/2;
			double u = m*xx+n;
	   		double AA = u*(1-xx*xx)*TMath::Pi();
			double BB = 2*((1+(1+u)*(1+u)-4*u/kappa*(1+u)*(1-u/kappa))*TMath::Pi());
	                double value = par[0]*(L1/gamma*kappa/2)*(AA/BB);

			return value;
	 }

void fitgraph() {

   TCanvas *c1 = new TCanvas("c1_fit1","The Fit Canvas",200,10,700,500);
   c1->SetGridx();
   c1->SetGridy();
   c1->GetFrame()->SetFillColor(21);
   c1->GetFrame()->SetBorderMode(-1);
   c1->GetFrame()->SetBorderSize(5);
   gStyle->SetOptStat();
   gStyle->SetOptFit();


// Pre-define histogram parameter
   Double_t nbinsx = 200;               // Bin number Y
   Double_t nbinsy = 30;                // Bin number Y
   Double_t Xemin = -0.001;
   Double_t Xemax = 0.135;
   Double_t Yemin = -1*1e-3;
   Double_t Yemax = 1*1e-3;


 // Open the sample fiile

	 TFile *file1 = new TFile("Q_zheng10.root","read");
	 TFile *file2 = new TFile("Q_fu10.root","read");
         TGraph *hzheng10, *hfu10;

	 hzheng10 = (TGraph *)file1->Get("Graph");
	 hfu10 = (TGraph *)file2->Get("Graph");
	 //Scale the histogram

	 double binwidth = (Xemax-Xemin)/200;
	 Double_t xaxis[200],yaxis[200];
	 for(Int_t n = 1; n<=200; n++)
	 {

		xaxis[n] = Xemin + binwidth*(2*n-1)*0.5;
		double *yzheng = hzheng10->GetY();
		double *yfu = hfu10->GetY();
		yaxis[n] = -0.5*yzheng[n] + 0.5*yfu[n];

	 }

	 c1->Divide(1,3);
	 c1->cd(1);
	 hzheng10->Draw();
         c1->cd(2);
	 hfu10->Draw();
	 c1->cd(3);
	 TGraph *hcha_10 = new TGraph(nbinsx, xaxis, yaxis);
	 hcha_10->GetXaxis()->SetTitle("Xe");
	 hcha_10->GetYaxis()->SetTitle("<Ye>");
	 hcha_10->GetXaxis()->CenterTitle(true);


	 //3. Fit
         TF1 *func = new TF1("func",fitf,0.05,0.1,2);
	 func->SetParNames("#zeta","beam angle x");

	 hcha_10->Draw();
	 hcha_10->Fit("func","R");
	 //func->Draw("same");
         //func->SetLineColor(kRed);

 }
Best regards,
Hurricane
