I’m having a problem regarding chi squared values for fits.
I am getting exceptionally large vales for chi^2/ndf and I am not sure what the problem is, since the data fits the curve almost perfectly.
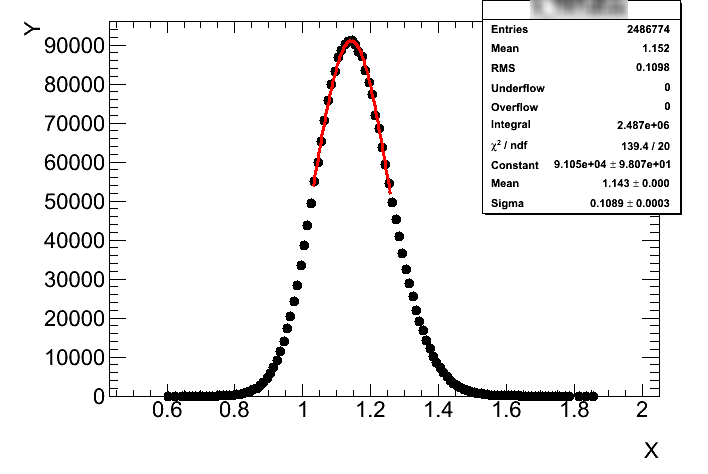
please see the attached link as an example - I’m getting values of almost 200! for a simple Gaussian fit…
your fit is not at all good, since the histogram is having a very large number of entries. You can see better the difference if you plot with the option “E” the histogram.
It seems to me you have also a large discrepancy in the tails.
If the statistics is correct (i.e you did not scale in the wrong way the histogram), it is maybe better to fit with two gaussians, one for the peak and one for the tails with a larger sigma.
Very simple, you have a very large statistics and your data points have a very small error.
Your model is slightly biased, because in reality is not exactly gaussian. This you don’t see by high, you should maybe plot the fit residuals, using TRatioPlot
Hi there, this is my first time on this forum. Nice to meet you.
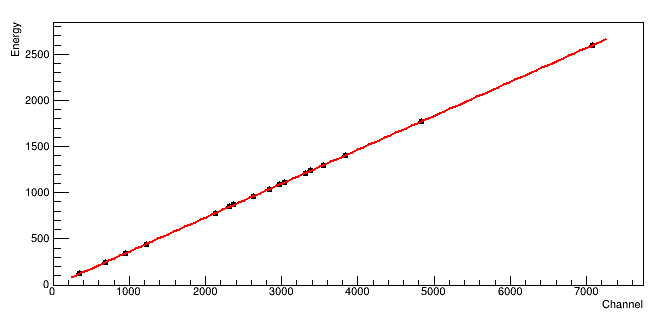
I am facing a similar problem. I am trying to fit a TGraphErrors (18 pts) with a third order polynomial. The problem is that the fit is giving me a reduced chi square value of 22817.4.
In principle even a first or second order polynomial would give me a decent fit result, but the chi square would be even larger. The error bars a very small, that’s true. I also tried to artificially increase the error bars but it still gave me a huge number. If I remove the error bars and I use TGraph instead, I get 0.0402568.
What am I missing? What can I do to solve the problem?
Thank you very much in advance
That would mean going back to the case where I have no error bars basically. In fact what I get as a reduced chi square value is exactly what I get by just using TGraph .
So, as you can clearly see … you get a huge chi^2 because … you heavily underestimate your errors (by a factor 150 or so) and/or (if you believe the errors are properly estimated) the function that you try to fit is not able to describe your data points well.
The picture, that you show, suggests that you try to fit some calibration curve: “peaks’ positions” versus “peaks’ energies”. I guess, the errors of the (well known) “peaks’ energies” (on the y-axis) can be very small (and that’s possibly what you use now) but you maybe completely neglect the errors of the “peaks’ positions” (on the x-axis). I assume the “peaks’ positions” come from the fitting of some “calibration spectra” so, their errors could be equal to e.g. the “peak means’ errors” returned by this fit (or their fitted “peaks’ sigmas”).