Hello,
I’m trying to reproduce some model data (blue line), but am having problems with my bin size. the majority of my data is at the farther end of the x-axis but I want to plot more data points at the lower scale.
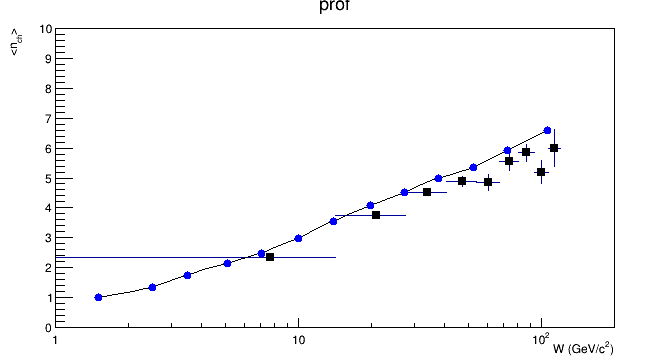
When I increase the bin size I observe these extra points in the lower x vales but get too many points at higher x-values. Is there a way of plotting using smaller bin sizes at lower at the x-axis.
The decleration of my TProfile looks like
TProfile* prof = new TProfile(“prof”, “prof”, 14, 1., 140 );
I also notice that despite declaring 14 bins I only observe 9 plotted points - is there a reason for this?
Thanks for nay help,
Alex.
