Hi,
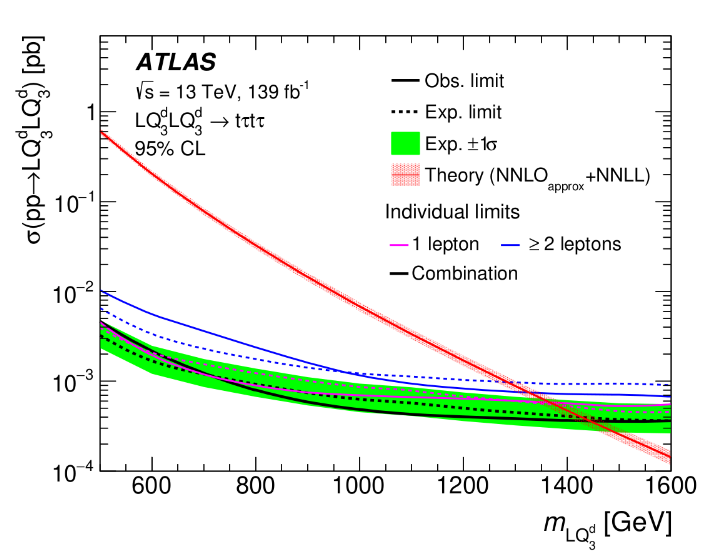
So, I want to reproduce a plot of the upper limit on the production cross-section as a function of mass from a paper(arXiv:2101.11582v2).
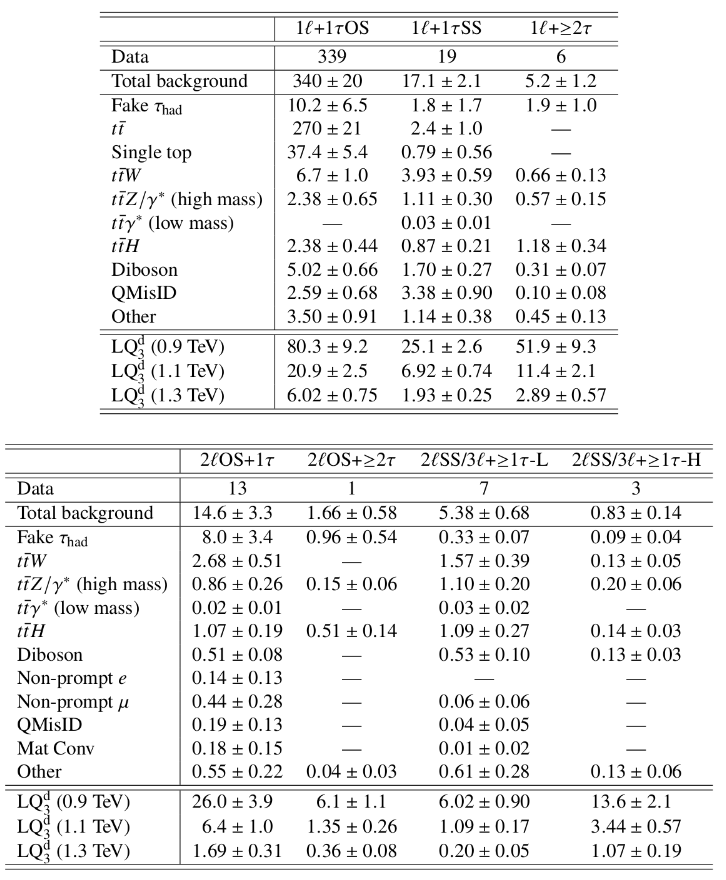
With the given information about Data, Total background, uncertainty in the background, expected signal, and uncertainty in expected signal yields separately in 7 signal region categories. I want to find out the upper limit on cross-section. I have this information for three mass values. First, I want to check at least for these mass points whether I am getting the right result by comparing them with the plot from the paper.
So, how do I do this?
I was looking at some of the exercise. Can I do using this or is there any other way.
However, I think this tutorial has no option to use expected signal events and corresponding uncertainty.
Also, they consider the background a nuisance parameter, but in my case, I already have the background events from the paper. Also, they consider it a simple counting experiment, but how can I do the same when considering seven signal regions?
Is there something where I can do this using RooFit/RooStats? Can this also be done using HistFitter or pyhf? I was also trying out those things, but my results never matched.
Or is there something wrong with my interpretation of the results? Because, I think the upper limit I am getting is on the number of signal events. Then, how do I correlate this to the cross-section? Since my branching ratio is one, I am multiplying the cross section with this upper limit on no. of signal events. Is this wrong? Or should I divide it with (LuminosityAcceptanceEfficiency)? However they have given the information about acceptance times efficiency for all signal regions combined. Then, can I use it here?
Any insights would be of great help.
Thanking you
Debabrata Sahoo