Hi all,
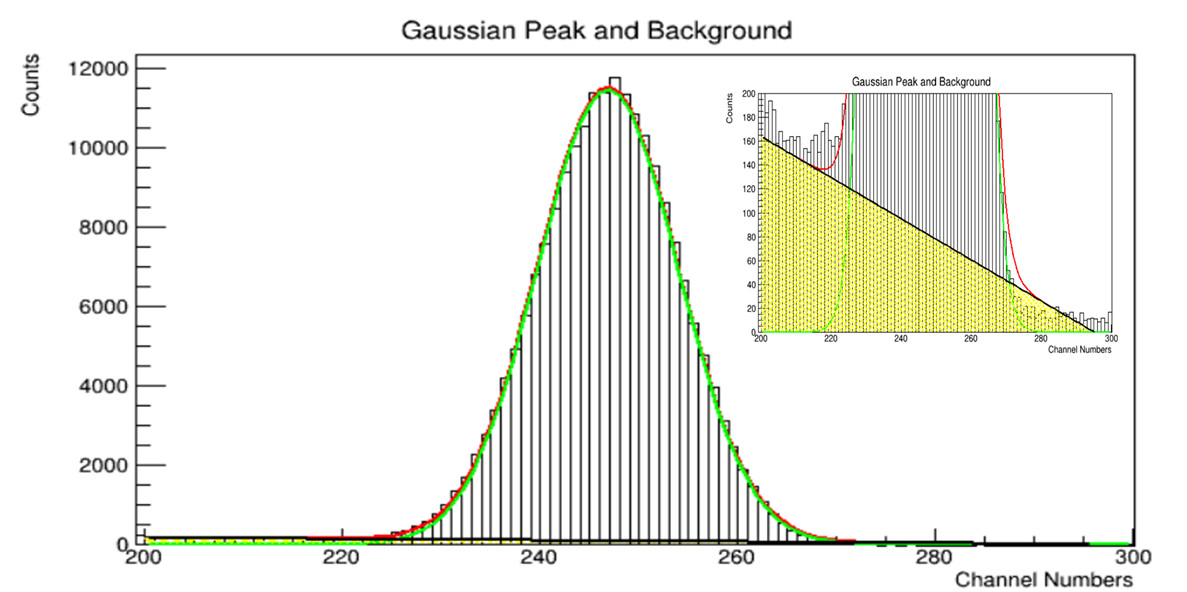
Let’s imagine we focus on a single 661keV Cs-137 peak in the first case.
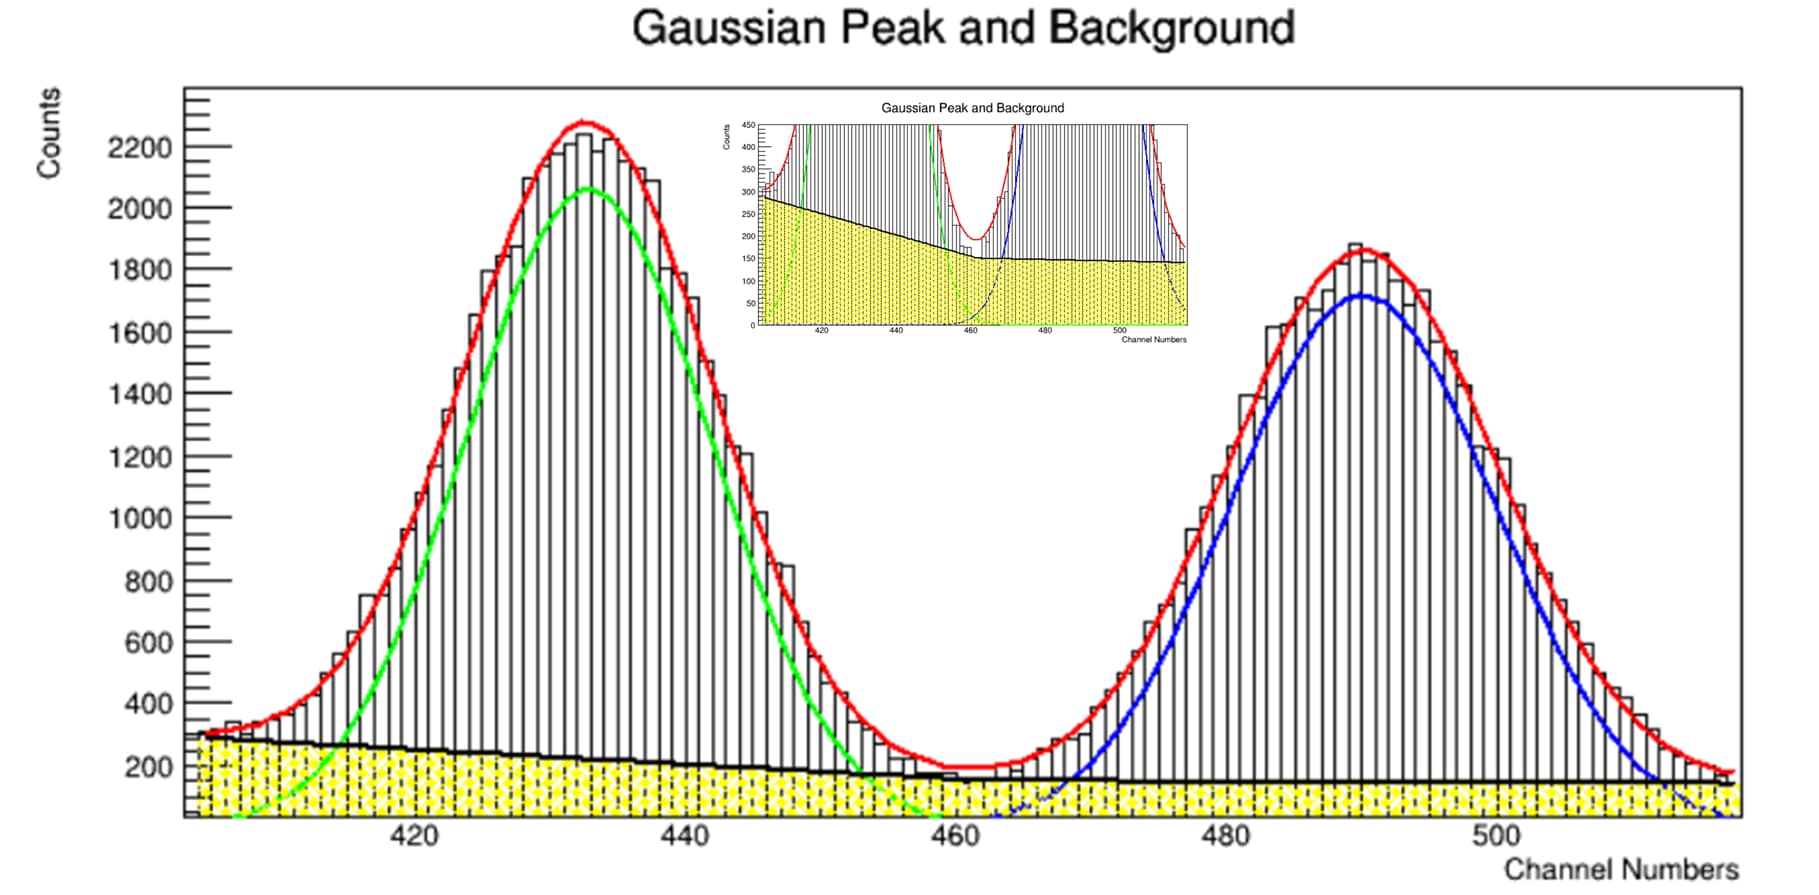
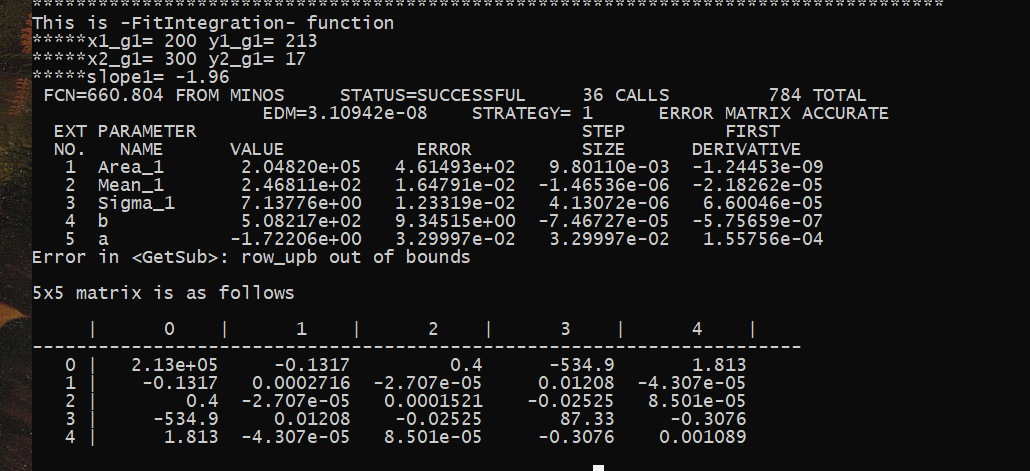
Then, in the next case, we focus on 2 overlapping peaks like 1173keV and 1332keV from a Co-60 source. In both situation, please consider only the 3 to 4 sigma peak coverage, so we are not interested in the entire spectra we collected. As you all know, the data from a detector can be extracted on a text file as 1 columb showing the counts corresponding each channel. Thus, you now get a discrete data. When you fit Gaussian function on those peaks, you have continuous data representation.
I think the counts as a vector, or random variable of the PDF fuction for Normal distribution. Depending on the peak number, you have either one mean and sigma like in Cs-137 case, or two means and sigma like in Co-60 case.
Question 1:
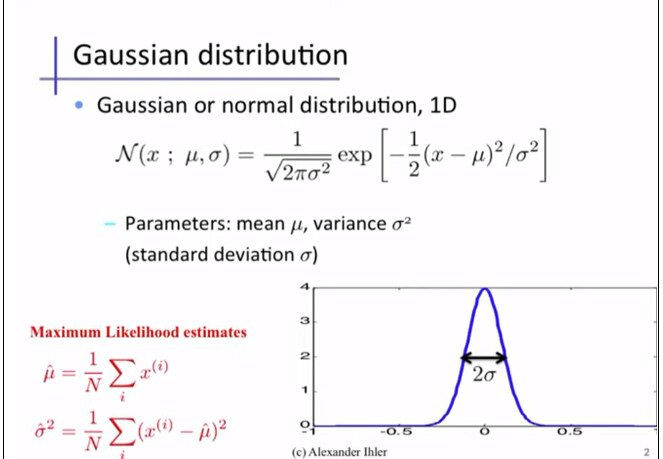
Now, will you consider Cs-137 case as a univariate Gaussian distribution case with random scalar variables contructed by the counts?
Question 2:
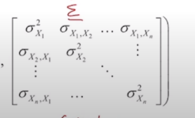
If you said yes to question one, then can we say we don’t need matrix notations for calculations? Can we also say that we don’t need covariance matrix for Sigma because there is onle one parameter for the mean and sigma?
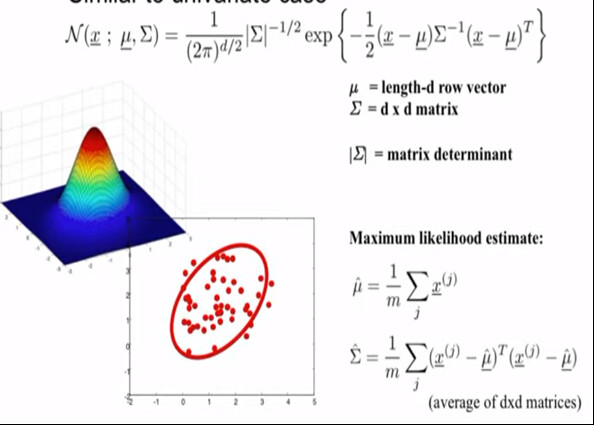
Question 3:
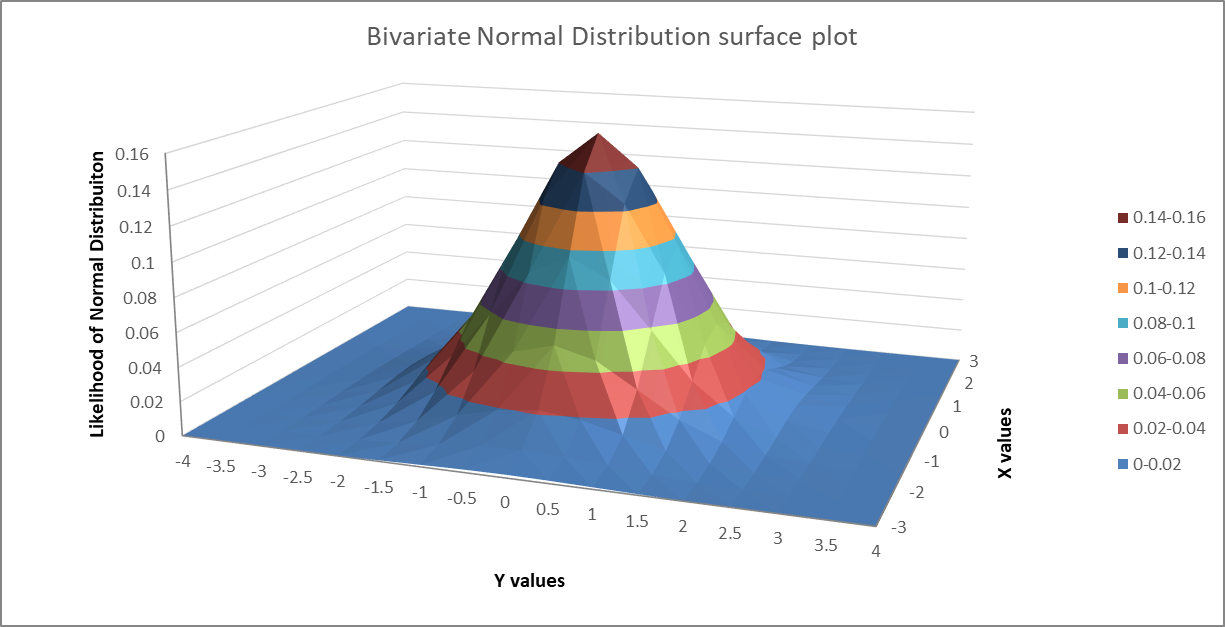
Will you consider Co-60 case as a multivariate Gaussian distribution case (in specific you can call it bivariate case) with random scalar variables contructed by the counts? That’s because we have a data set of counts, we have two means and two sigmas in total to fit, so we need matrix and vector notations in our calculations.
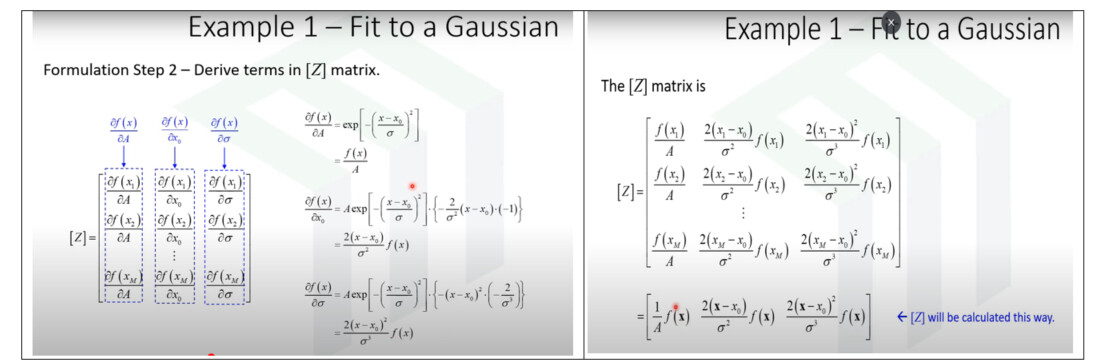
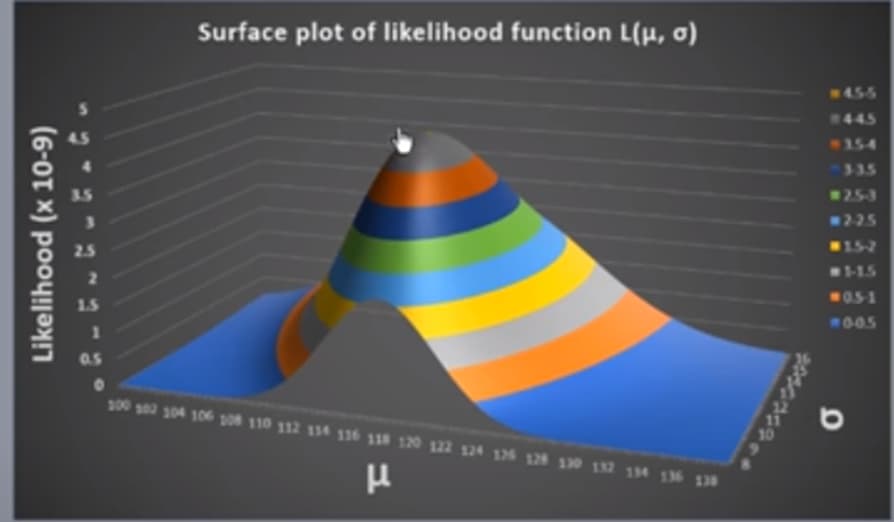
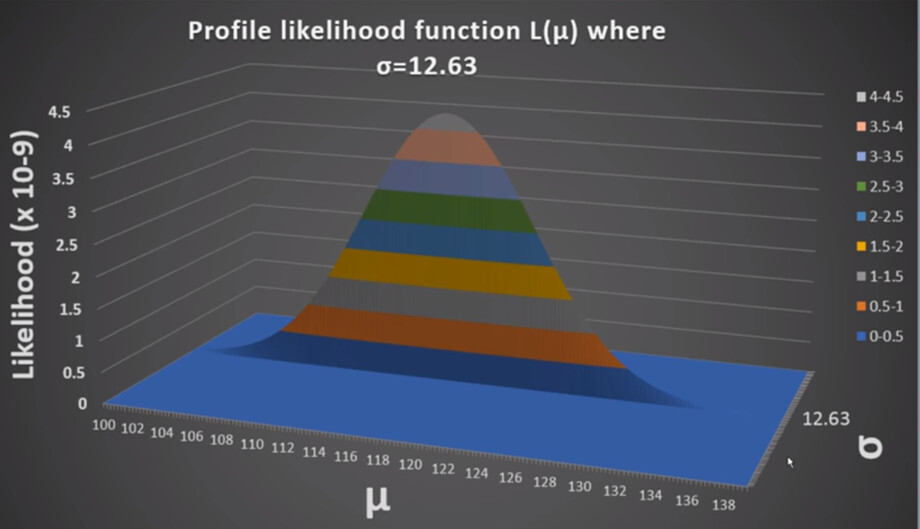
Some pictures to help to visualize the questions:
Cheers.