Hi,
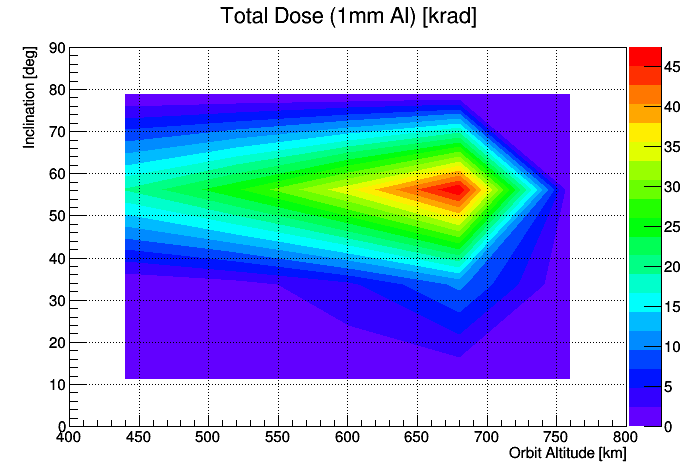
I’m simulating the total dose of a space mission, and I’m plotting it as a function of altitude and inclination. When plotting with TH2D I get undesirable axis ranges. I’m plotting doses for the altitude range (400km,800km) and inclinations range (0deg,90deg). The graph seems to be shrinked on the canvas (I’m sure its something I’m doing wrong myself  ).
).
I’m attaching the resulting graph and the code.
Thanks in advance 
Leonardo.
GOMX3_Doses.C (2.62 KB)