Hi everyone,
Me and my lab partner are doing an undergraduate lab using the 13 TeV ATLAS open dataset.
We have been using the monte carlo data for the Higgs decaying into 2 photons (all 4 production processes combined). We produce the following 2D histogram, with the etcone and ptcone variables for the highest transverse momentum photons on the x and y axis respectively, with MeV units:
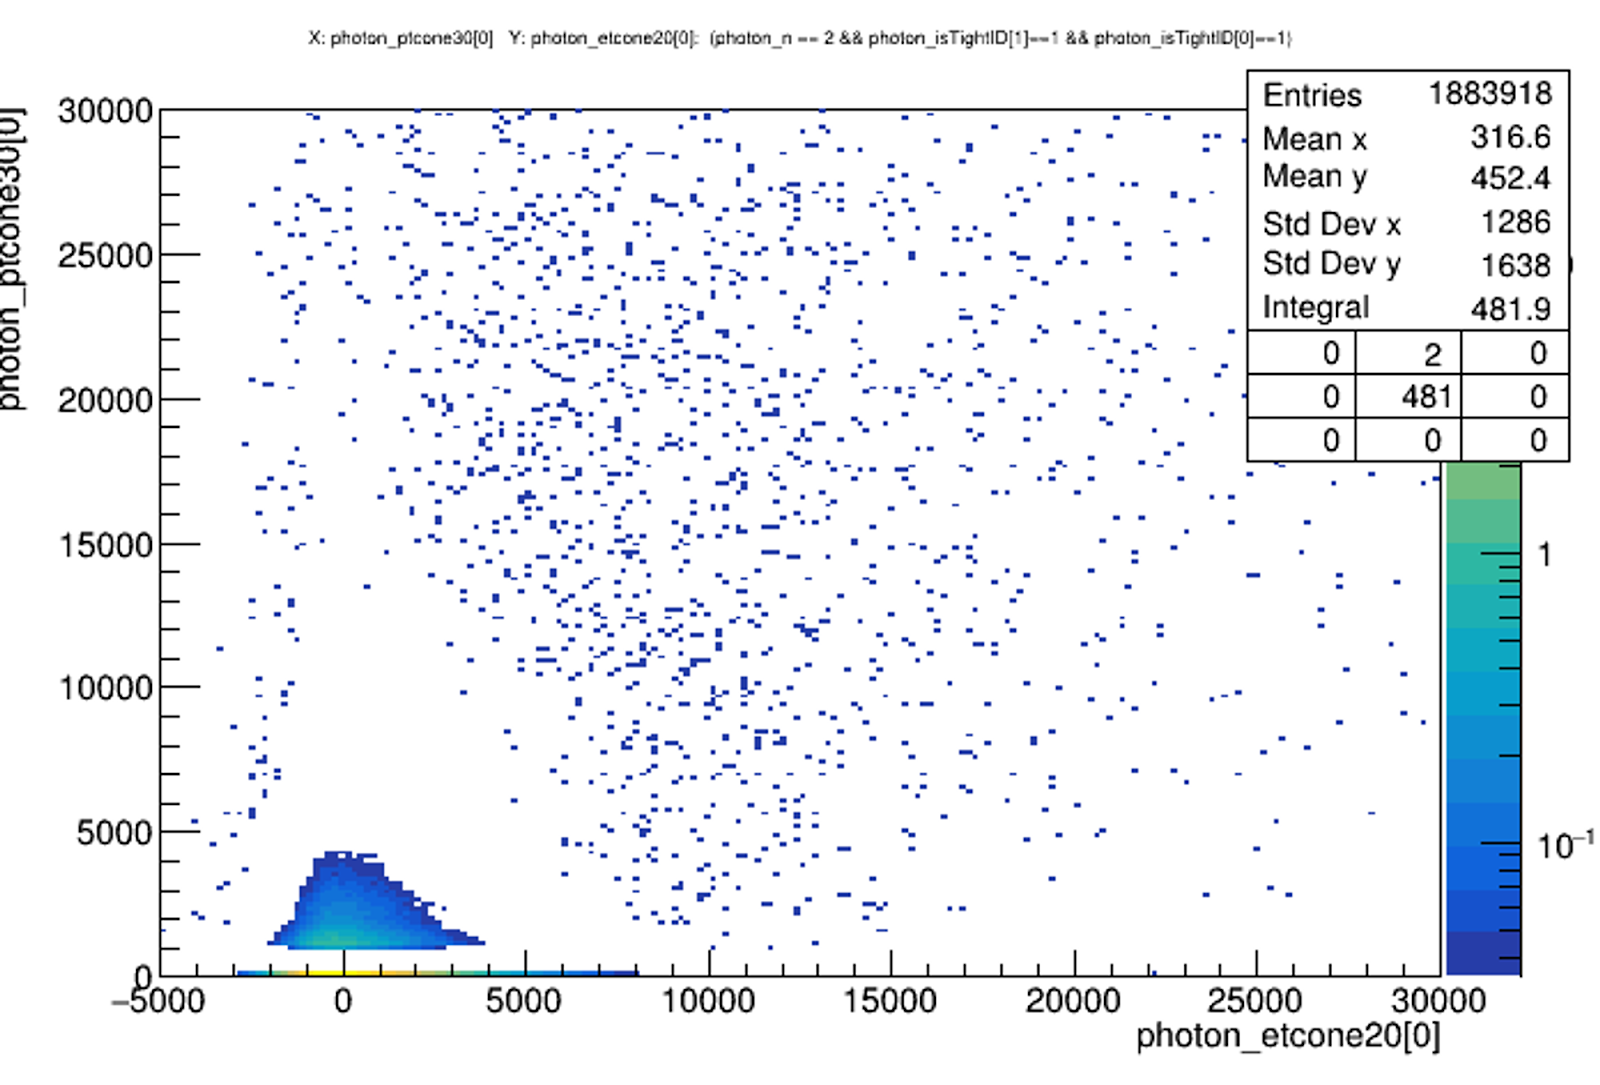
Note the empty region - does anybody know why this occurs? Are jets associated with Higgs production guaranteed to have high transverse energies/momenta? Is there reasoning for the diagonal boundaries of this region?
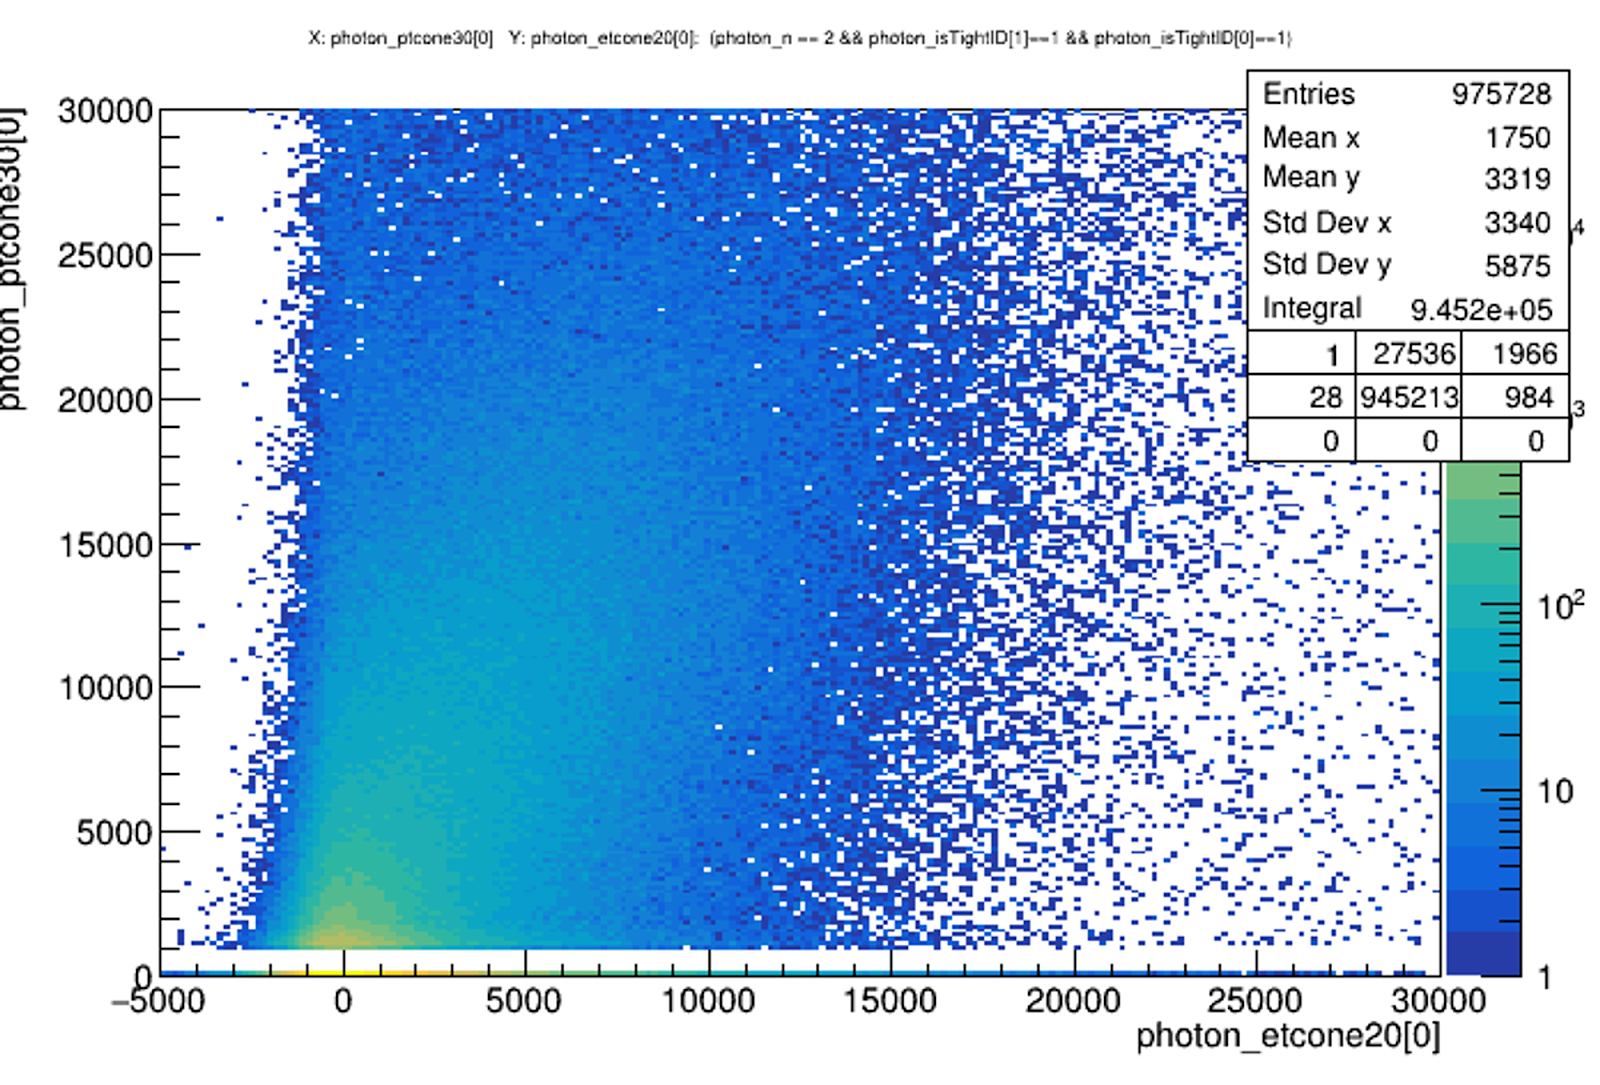
Here is real data, with a 2 photon selection cut applied, for comparison:
Any insight is appreciated, even if that’s telling us a better place to ask this question ![]()
Thanks,
Tom