I am trying to calculate the number of events in my signal fit by following this thread: Integral Error in Signal
fileName = "/Volumes/Backup/CSV_DATA/RGK/6535MeV/R5893/MM2_EP_b_pFD.csv"
rdf = ROOT.RDF.MakeCsvDataFrame(fileName)
h1 = rdf.Histo1D(("MM2_EP_b", "MM2_EP_b", 100, 0.15, 0.475), "MM2_EP_b")
h1.GetYaxis().SetRangeUser(0,85000)

fg = ROOT.TF1("fg", "gaus(0)")
fbc = ROOT.TF1("fbc", "pol2(3)")
f1 = ROOT.TF1("f1", "gaus(0) + pol2(3)", 0.15, 0.475)

f1.SetParameters(17300, 0.3, 0.02, 47510, 73250, 105200)
r1 = h1.Fit(f1, "S")

c1 = r1.GetCovarianceMatrix()
c1g = c1.GetSub(0, 2, 0, 2)

fg.SetParameters(f1.GetParameters())
N_sig = fg.Integral(fg.GetParameter(1) -(3.0*fg.GetParameter(2)), fg.GetParameter(1)+(3.0 * fg.GetParameter(2)))/h1.GetBinWidth(1)
N_sigErr = fg.IntegralError(fg.GetParameter(1) -(3.0*fg.GetParameter(2)), fg.GetParameter(1)+(3.0 * fg.GetParameter(2)),fg.GetParameters(),c1g.GetMatrixArray())/h1.GetBinWidth(1)

fbc.SetParameters(f1.GetParameters())
N_bg = fbc.Integral(fg.GetParameter(1)-(3.0*fg.GetParameter(2)), fg.GetParameter(1)+(3.0 * fg.GetParameter(2)))/h1.GetBinWidth(1)
N_bgErr = fbc.IntegralError(fg.GetParameter(1) -(3.0*fg.GetParameter(2)), fg.GetParameter(1)+(3.0 * fg.GetParameter(2)),fbc.GetParameters(),c1.GetMatrixArray())/h1.GetBinWidth(1)

N_tot = f1.Integral(fg.GetParameter(1)-(3.0*fg.GetParameter(2)), fg.GetParameter(1)+(3.0 * fg.GetParameter(2)))/h1.GetBinWidth(1);
N_totErr = f1.IntegralError(fg.GetParameter(1)-(3.0*fg.GetParameter(2)), fg.GetParameter(1)+(3.0 * fg.GetParameter(2)),f1.GetParameters(),c1.GetMatrixArray())/h1.GetBinWidth(1)

fSig = ROOT.TF1("fSig","gaus", 0.15, 0.475);
for ipar in range(0,3):
    fSig.SetParameter(ipar,f1.GetParameter(ipar))
    fbc.SetParameter(ipar,f1.GetParameter(ipar+3))
When plotted I get the following
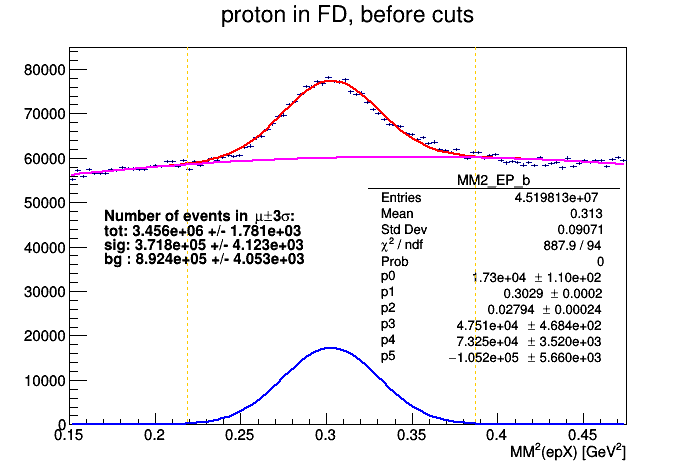
The values of the integral seem off to me, and as a sanity check I wanted to see if I could get a total pdf integral value similar to the value listed in Entries in the stats bar. I get a value that is an order of magnitude off.
print("tot: %.3e" % (f1.Integral(0.15, 0.475) / h1.GetBinWidth(1)))
tot: 6.293e+06
This would indicate to me that I am not getting the correct integral values. I believe there must be an error in how I am calculating the integral but I am new to pyROOT and am not sure what I could change in my code to get the correct value. Can anyone tell me what I’m doing wrong with my fits?
Data was too large to post so I have attached a sample in a zipped folder
ROOT Version: JupyROOT 6.24/06
Platform: macOS Monterey 12.2.1
Compiler: Jupyter Lab
sample.csv.zip (2.6 MB)