Uncertainty resulting from double fit

Hi ROOTers,

We wrote this code in order to extract the breakdown voltage of a SiPM from an I-V curve.

{

TCanvas c("c", "Curve I-V", 1920, 1980);
c.SetFillColor(0);
c.SetBorderMode(0);
c.SetBorderSize(2);
c.SetGridx();
c.SetGridy();
c.SetTickx(1);
c.SetTicky(1);
c.SetFrameBorderMode(0);
c.SetLogy();

gStyle->SetOptFit(111);

TGraphErrors g("hamamatsu_S13_8x8_0C.txt", "%lg %lg %lg %lg");


g.GetXaxis()->SetTitle("Voltage [V]");
g.GetXaxis()->SetNdivisions(1925);
g.GetYaxis()->SetTitle("Current [nA]");
g.GetYaxis()->SetNdivisions(748);
g.SetTitle("Curve I-V");

 
 TF1* f2 = new TF1("f2","[0]+[1]*x+[2]*x*x");
 g.Fit(f2,"","same",50,53);
 g.Draw("ap");
 
 
 double* pars =  f2->GetParameters();
 TF1* fpar = new TF1("fpar","[0]+[1]*x+[2]*x*x",49.9,57); 
 fpar->SetParameters(pars);
 fpar->Draw("same");

 TF1* f1 = new TF1("f1","[0]+[1]*x");
 g.Fit(f1,"","same",46.5,49); 
 
 double* lin = f1->GetParameters();
 TF1* flin = new TF1("flin","[0]+[1]*x",46,54);
 
 flin->SetParameters(lin);
 flin->Draw("same");
  
}

My question is, is there a way to automatically obtain the point and error associated with the intersection of the two fits? How?

The file in order to run the code is hamamatsu_S13_8x8_25C.txt.

Maybe you can try writing a piecewise fit function, with the break point being a parameter.

e.g. something like (completely untested…)

//define piecewise function, [0] is the breakpoint 
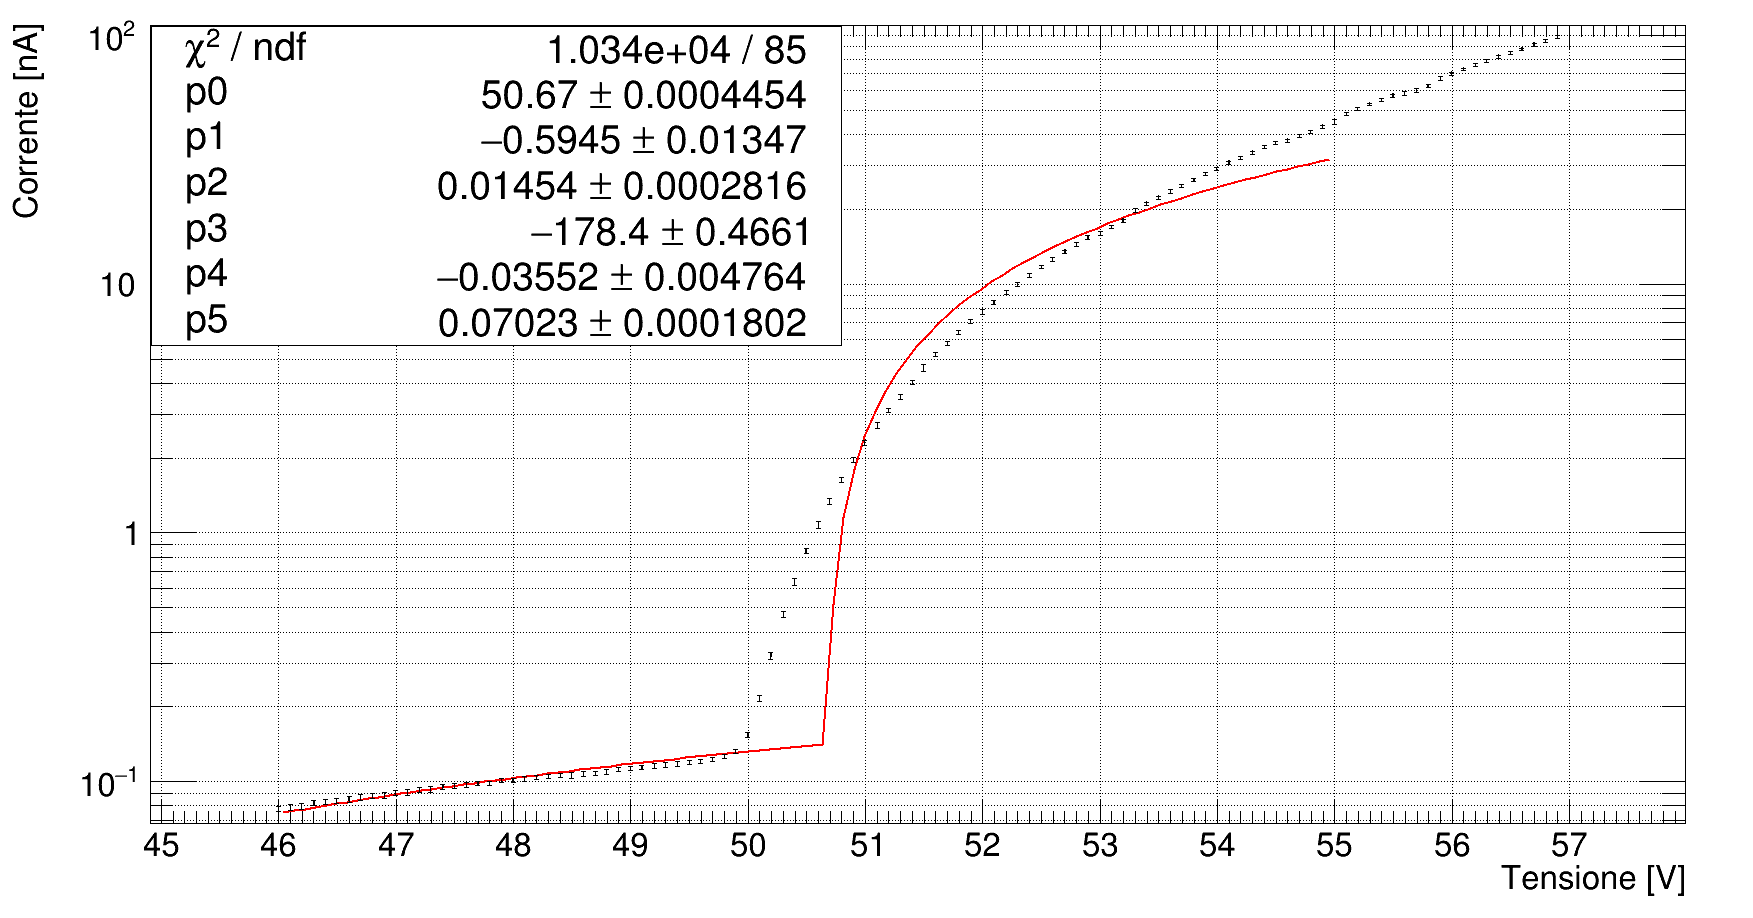
TF1 * fboth  = new TF1("fboth", " (x < [0]) * ( [1] + [2]*x)  + (x > [0]) * ([3] + [4]*x + [5] * x*X)", 46, 57)
// initialize parameter from individual fits
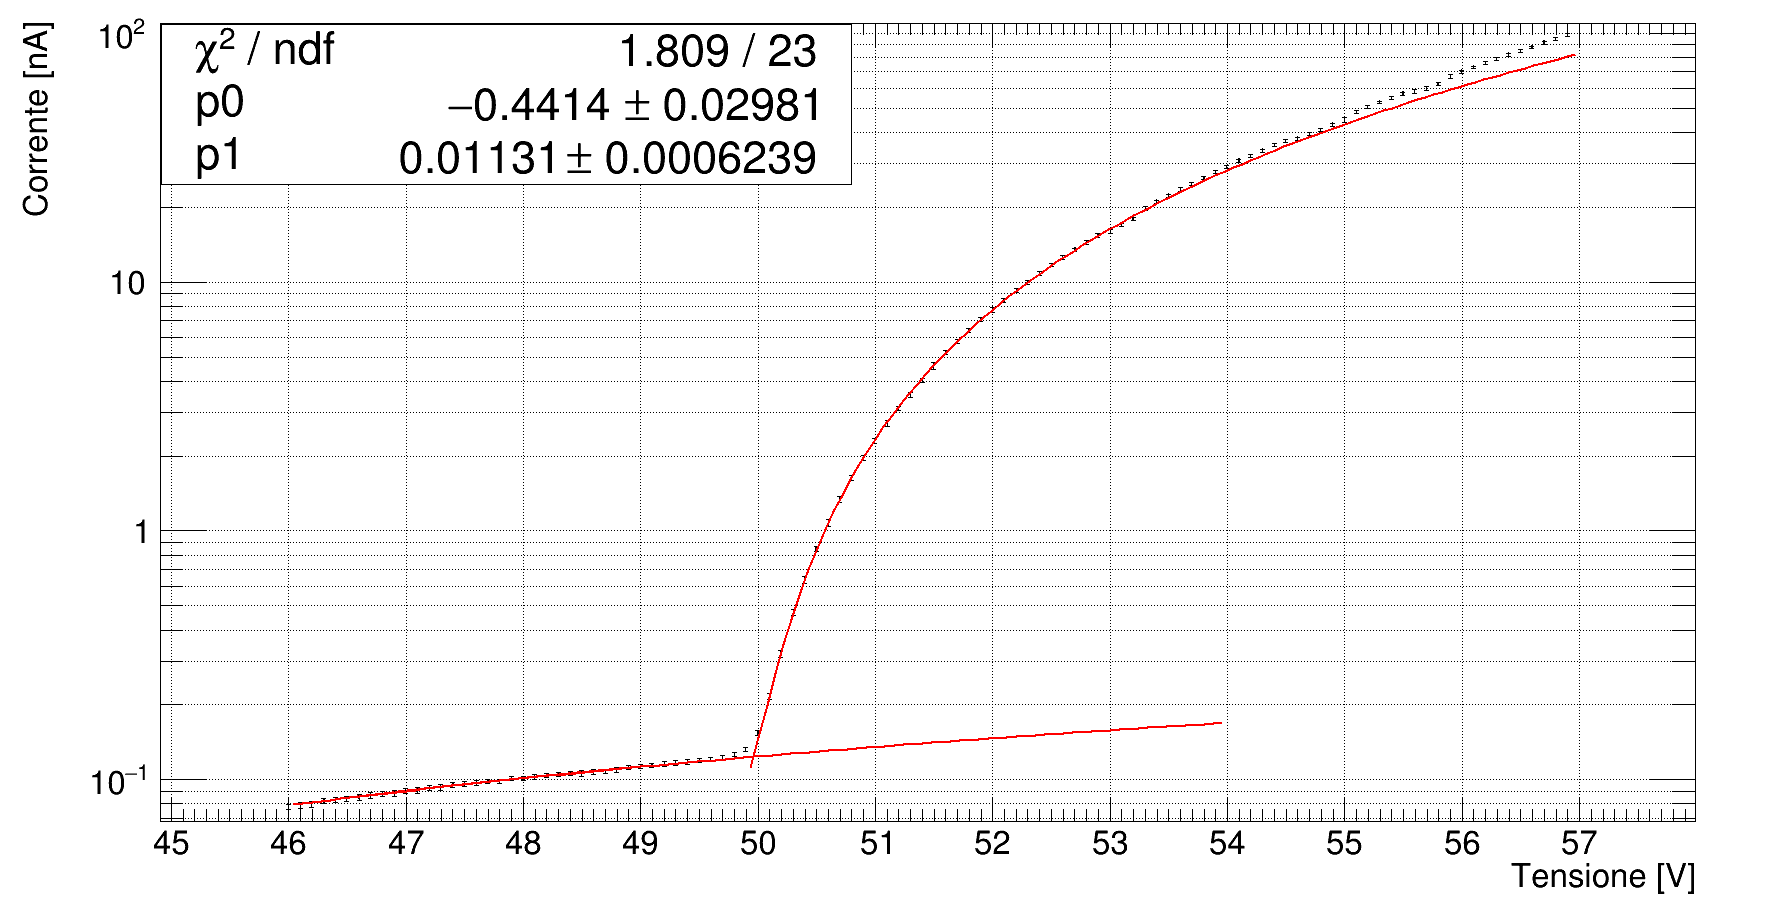
fboth->SetParameter(0,50); // a guess from looking at your plot
fboth->SetParameter(1, f1->GetParameters()[0]); 
fboth->SetParameter(2, f1->GetParameters()[1]); 
fboth->SetParameter(3, f2->GetParameters()[0]); 
fboth->SetParameter(4, f2->GetParameters()[1]); 
fboth->SetParameter(5, f2->GetParameters()[2]); 

// give it a different color :) 
fboth->SetLineColor(2); 

// do the fit
g.Fit(fboth,"","same", 46,57); 

You can of course smoothly go between the two functions instead of suddenly by making a slightly more complex function.

Thanks for the reply. Your code does not work…

Hi,
try this way to define a piecewise function

TF1* f2 = new TF1("f2","x<[0]?[1]+[2]*x:[3]+[4]*x + [5]*x*x");
f2->SetParameter(0,51);
f2->SetParLimits(0,49.,52);
g.Fit(f2,"","same",46.,55);
1 Like

Thanks for the reply. The code is good, the fit not to much:

I tried to change the range, but nothing changed!

I just give a range and a starting point for parameter 0.

To improve the fit I can only think of two things

  • Fit the two region separately and used such parameters as starting point for the piecewise function
  • Use a narrow range for parameter 0, maybe try to use (49.5 , 50.3)

Hopefully this is enough to improve the fit

Try the macro attached below.

In ROOT, before you try to fit your graph or histogram, you MUST set “reasonable” initial values for ALL parameters of your function (except for some “built-in” formulas, like “gaus”, for which the standard fit procedure can automatically “guess” them). Otherwise, the fitting procedure may easily misbehave.

You could try to make the macro more “robust” (it maybe helps when the initial parameters are not good) by enabling something like this:

  f->SetParLimits(2, 0., 1000.); // b_left >= 0
  f->SetParLimits(3, 0., 1000.); // b_right >= 0
  f->SetParLimits(4, 0., 1000.); // c_right >= 0

hamamatsu.cxx (2.2 KB)

1 Like

Thanks for your time. It is a very good option to fit this point!

This topic was automatically closed 14 days after the last reply. New replies are no longer allowed.