Dear Experts,
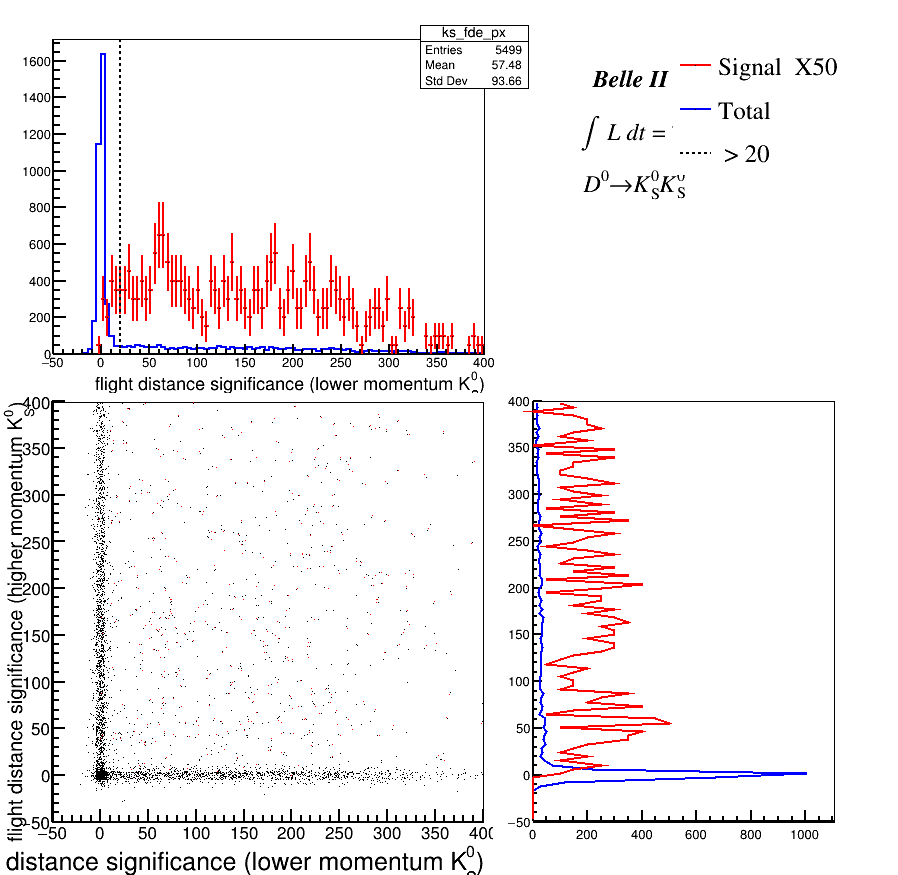
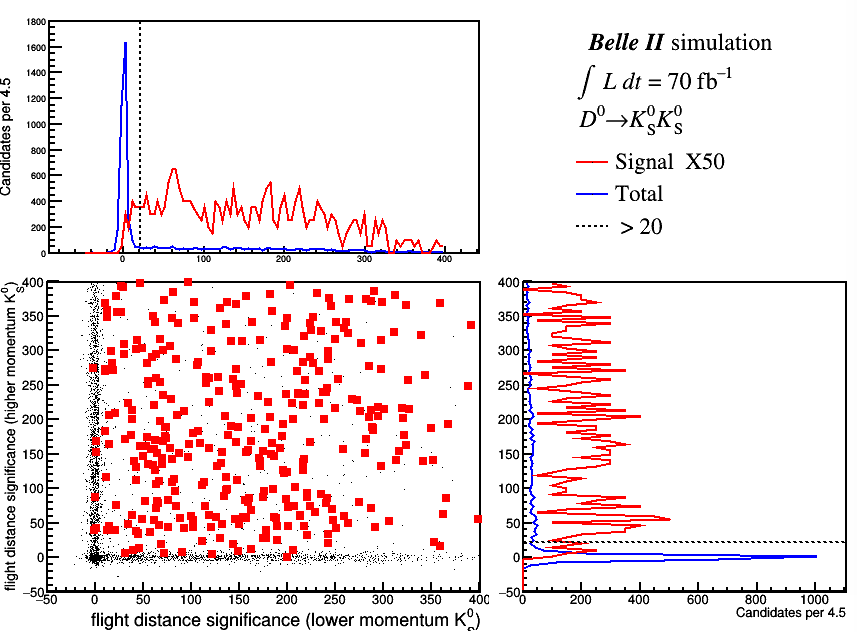
I am trying to make a 2D plot and its 1D projections. Here’s the macrob2_style_pad.C (7.0 KB) and the root file for_fds_plots.root (177.2 KB) that i am using. The resulting plot that I get, is:unnamed.pdf (67.3 KB) I want the bottom right plot to have the same style as that of the top left plot and the 2D his to gram should look like: for_approval_2D_fds.pdf (124.8 KB) But, even after including all the required lines in the macro, I am not able to get the plots in the required style. It think it is some default settings which comes with hbar.
It will be really great if you helped me sort it out.
You are trying to use “hbar” draw option to draw histogram with swapped axes.
As options says - it always draw bar for each bin, therefore you cannot get line out of that drawing.
To be able draw that you want, you have to create TGraph object and specify (x,y) points as you want.
Thanks a lot @linev, As I want the same style for both the projections, So I have used TGraph for the top left plot as well. Here’s the modified macro.b2_style_pad.C (8.4 KB) . However, there is another issue with the markers of the 2D histogram. I am aable to change the marker attributes (of the histogram that is dram in sames, h2) using the draw panel but I can’t do the same for the markers for h1. Would you please help me fix that too?. Here’s the current result.
it is there in the code I have used a root file towards the upper part, below TGraph *make_swapped_graph1(TH1 *h2). h1 and h2 are drawh on the Center pad, line 206 in my code.
Could we make a Scatter plot instead of the 2D histogram because the 1D projections are now graphs?