Two functions with "C" option drawn in same canvas

Hello,
I wanted to draw two (or more) user defined functions in the same pad of a canvas with the “C” curve option, but the “C” option only works for the first function. The bottom line is:

TF1 *f1 = new TF1("f1","x-1",0,5); f1->Draw("P"); TF1 *f2 = new TF1("f2","cos(x)",0,5); f2->Draw("P,same");

The function f2 is drawn in the same pad as expected, but only with the default “L” option. (For this example I chose “Psame” insteadt of “Csame”, none of the worked).

Thanks a lot for any ideas to solve this problem!
Cheers,
Jonas

I cannot reproduce this problem. Which version are you using?

Rene

Thanks for the fast answer.
I’m using Version 5.17/05 16 October 2007 on a Kubuntu Linux system, installed from the debian packages by Christian Holm Christensen

I installed Version 5.20 from source and I still have the same problem, the cos(x) from above example is plotted as “L”.

I cannot reproduce this problem with any version of ROOT. Could you post the exact script that you claim not working?

Rene

Actually when I apply the code exactly as above I got what I attached to this message (using Version 5.20/00 24 June 2008)
My problem is that the cosinus graph is not drawn dotted, ie means my problem in general is that if I plot a function with the “same” option, it doesnt accept any additional drawing options like “C” or “P”.

Can I change the default draw option for drawing functions to “C” instead of “L”? That would help me as well.

OK, it is a different question. Your output above is correct.
Use
f2->SetLineStyle(3) to set the line style to whatever you want

see: root.cern.ch/root/html/TAttLine.html

Rene

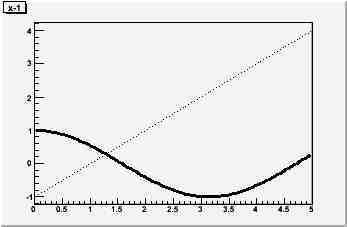
I think there is actually a slight difference, because when it is drawn just with the “L” option and afterwards changed to SetLineStyle(3), just the “L” line (straight connections between datapoints) is dotted. In my case I wanted to have a “smooth curve” between the data points, because otherwise my plot looks not very nice.

The complete code is (c++):

[code]#include
#include
#include
#include
#include

#include <TROOT.h>
#include <TSystem.h>
#include <TF1.h>
#include <TCanvas.h>
#include <TApplication.h>

using namespace std;

double func_power_sum(double x[], double par[]){
double P0 = par[0];
double tau0 = par[1];
double t0 = par[2];
double n_pulses = par[3];
double t =x[0];

double result = 0.;

for (int i=0;i<n_pulses;i++){
	result += P0*exp(-(t-i*t0)*(t-i*t0)/(2.*tau0*tau0));
}

return result;

}

int main(int argc, char *argv[]) {
TApplication theApp(“App”, &argc, argv);

TCanvas *a = new TCanvas(“a”,“a”,1200,700);
a->cd();
TF1 *f_broadening_2ns[4];
char temp_f_name[256];
for (int i=0;i<4;i++){
sprintf(temp_f_name,“f_broadening_2ns_%d”,i);
f_broadening_2ns[i] = new TF1(temp_f_name,func_power_sum,0,22,4);
f_broadening_2ns[i]->SetParameters(1,0.5+i/10.,2,10);
if (i==0){
f_broadening_2ns[i]->Draw(“C”);
}else{
f_broadening_2ns[i]->SetLineColor(i+1);
f_broadening_2ns[i]->Draw(“C.same”);
f_broadening_2ns[i]->SetLineStyle(2);
}
}

theApp.Run();
}[/code]

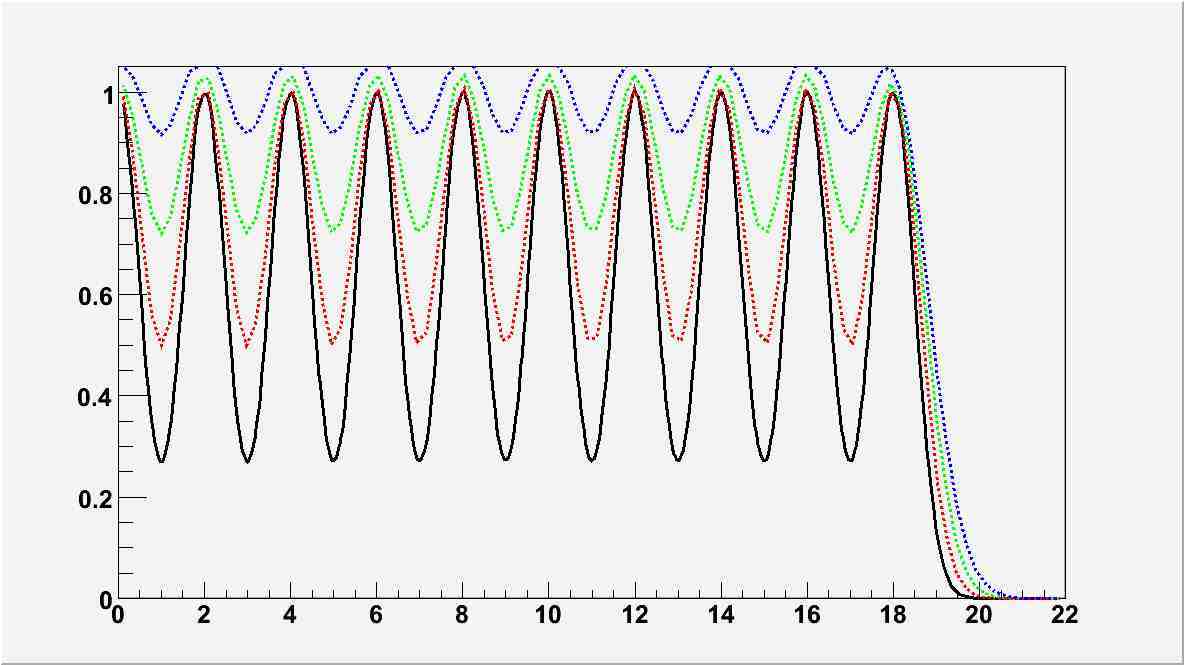
The black function is drawn with “C” option and produce a smooth curve, the three other owns are jagged.

Is there way to increase the number of data points used for the function? That would be perhaps even better.

thanks for so much effort!
[/code]


see TF1::SetNpx

Rene

Thanks Rene for all the effort, that saves my plot!!