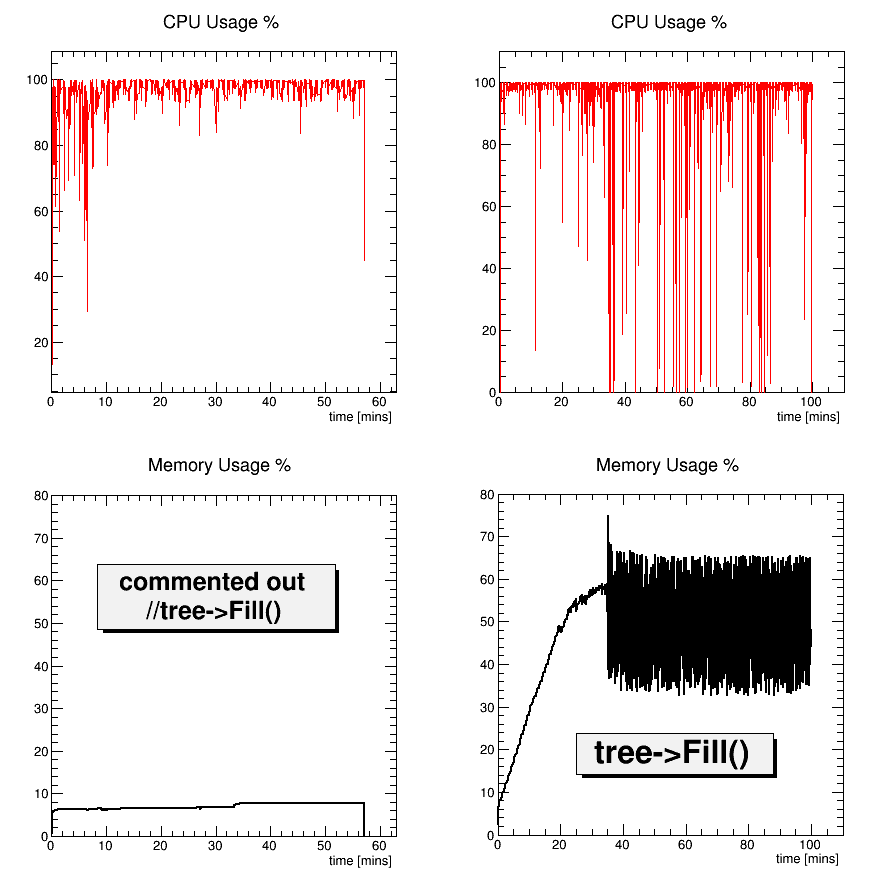
I have a massive memory leak in my program which involves writing data to a rootfile. I have traced it to one line, ttree->Fill(). Commenting this out results in no leak, however if this is not the case the memory consumption is huge, and grows very quickly. I am writing a lot of data but when calling ttree->AutoSave() or ttree->FlushBaskets(), every n events, both return 0 bytes written.
	if(recordCount_ % 50 ==0){
		Long64_t bytesWritten = tree->AutoSave("FlushBaskets");
		int bytesWritten2 = tree->FlushBaskets();
		std::cout << "\nBytes written to file: " << bytesWritten2 <<std::endl;
		tree->Print();
	}
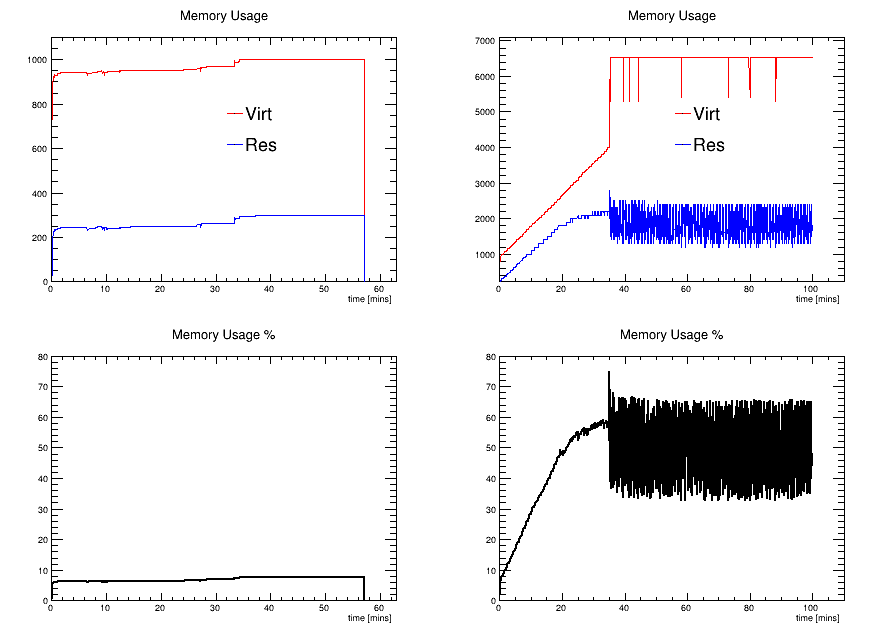
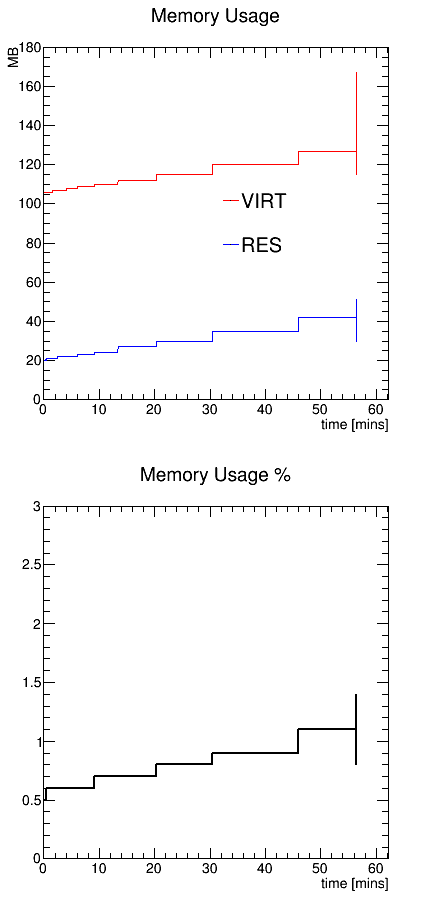
I have attached the memory usage of my computer when running it for both cases, as a function of time.
I think it would be helpful if you explicitly said WHICH memory related field / column you monitor in “top”. In general, there are (at least) three, called “VIRT”, “RES” and “SHR” (see “man top” for details).
That said, I tried the “testFill.C” macro (from the [url=https://root-forum.cern.ch/t/increasing-memory-usage-by-tbranch-fill/17095/1 post by davide84[/url]) on two Linux machines (gcc 4.4.x). The “root.exe” process uses something like 35 - 40 MB “VIRT”, 15 - 20 MB “RES”, 10 MB “SHR” on a 32-bit i686 system and 105 - 110 MB “VIRT”, 25 - 30 MB “RES”, 10 MB “SHR” on a 64-bit x86_64 system.
Can you, please, instead of all these nice plots provide a minimal code fragment reproducing your problem with huge memory leaks, as soon as you trace it down to the TTree::Fill?
Otherwise, what do you expect from us looking at plots? They look cool, ok.
What are the units on the “y” axis for “VIRT” and “RES” memory?
If these numbers are in “megabytes”, then … (well, I assume you use a 64-bit system and your “root” application is compiled as a 64-bit one) …
your “root” application uses quite a lot of RAM -> 1 - 7 GiB “VIRT” (can you account for the initial 1 GiB?) -> does you machine have enough RAM installed (more than 10 GiB, I would say) or does it start to “swap” when running your application?
Well, to me it seems that there’s a strange jump at the “time” around 35 min. …
… it seems to be correlated with “VIRT” memory usage exceeding 4 GiB (that might be related to some problem with some 32- bit counter which simply overflows)
… it seems to be correlated with “RES” memory usage exceeding 2 GiB -> can you check
[bash]$ ulimit -S -a
[bash]$ ulimit -H -a
[tcsh]$ limit
[tcsh]$ limit -h
and make sure that you do not exceed any limits
… can it be that you write to a file which is located on a filesystem which imposes 2 or 4 GiB file size limit?
(Well, it seems to me that this strange jump is somehow also visible in the plots in which you commented out the “tree->Fill()”.)
Just for curiosity … can you create such pictures for the “testFill.C” macro (from the [url=https://root-forum.cern.ch/t/increasing-memory-usage-by-tbranch-fill/17095/1 post by davide84[/url])?
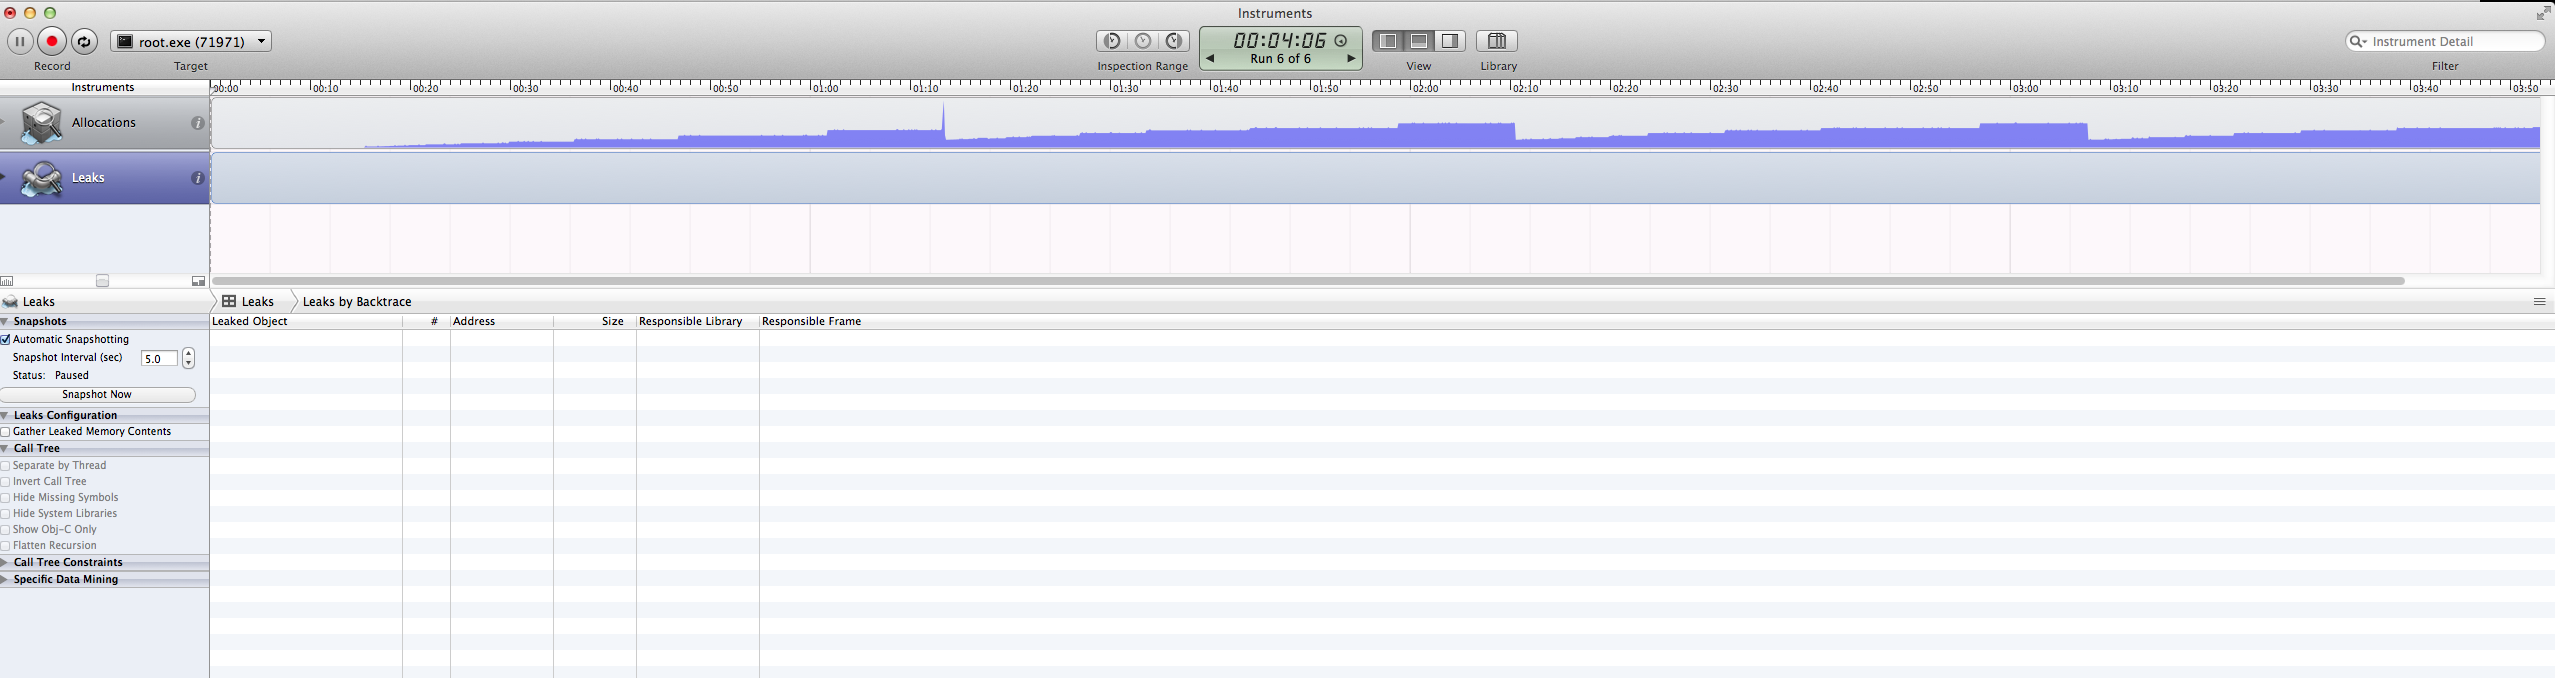
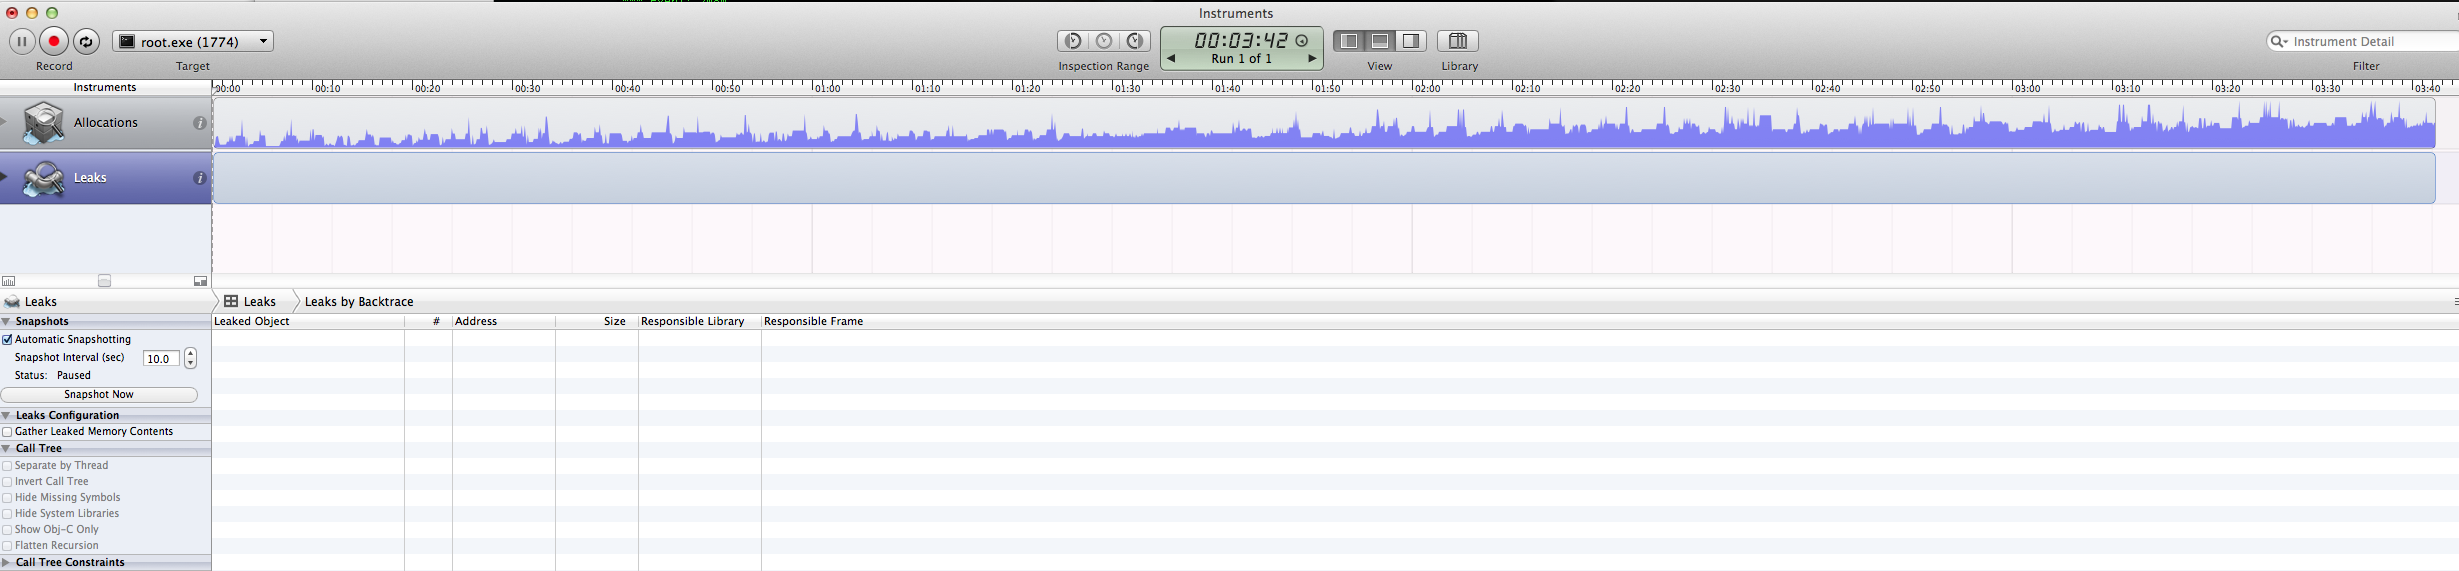
After I fixed the macro you linked (see attachment), I have the following picture in the ‘Instruments’ application, with a memory-leak detector active. No leaks found (and memory usage is like a saw between function calls).
[quote]Here is the code that I am using to fill the tree, called in my Geant4TrackingProcessor Class.
[/quote]
I’m sorry, I need the code which reproduces your problem which I can run on my machine to test.
I’m not able to use these pieces you copied. Try to: create the same structure/code you have (tree, branches) and tell me approx. amount of data your are using and check, if you still see the leak.
Discussing particular system’s memory management is quite useless unless you are familiar with implementation details/algorithms. Claiming TTree has a leak without providing a working code to reproduce - is also useless.
Ok I have tried to simplify the code the best I can, and it contains the data and methods for writing to the ttree. The files are attached. testFill2.C (2.67 KB) DataLib.C (718 Bytes) DataLib.hh (4.88 KB)
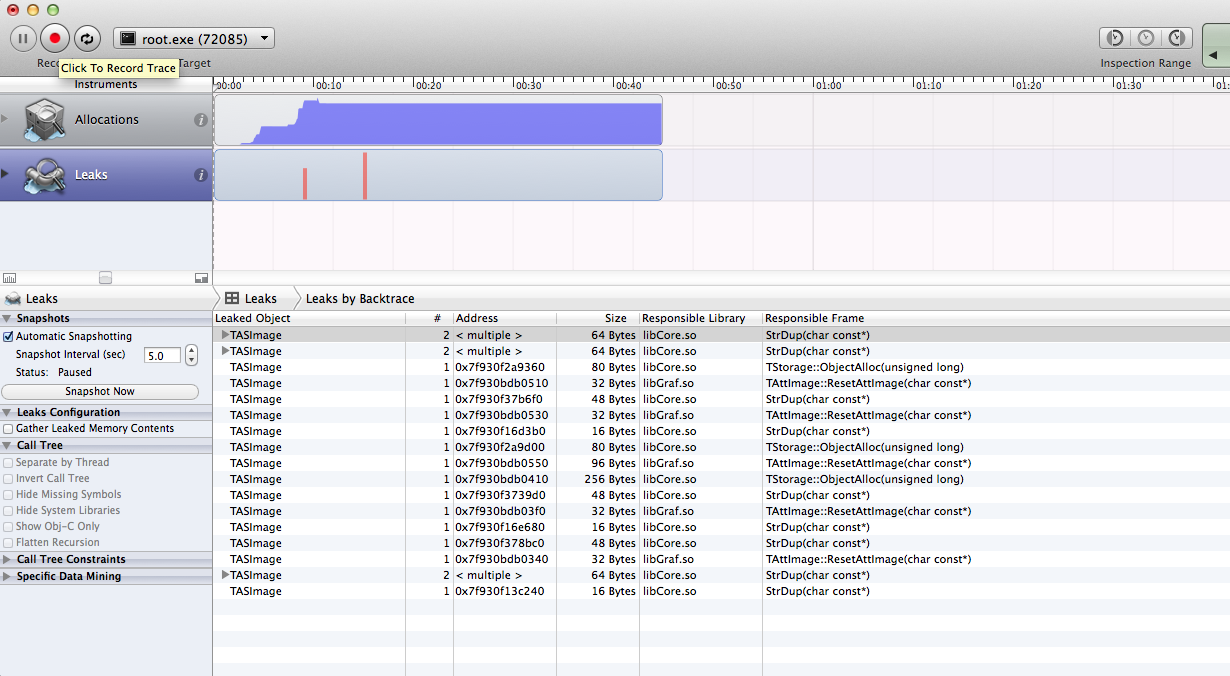
Unfortunately, your code failed to demonstrate a memory leak you’ve mentioned. After I spent some time fixing different errors you have, I was able to run it and attach ‘leaks’ tool from the ‘Instruments’ app to the ROOT’s process. Here’s the screen shot.
Fixed. The problem was not the code I uploaded but the way it was implemented in our software. I have realised that it was simply due to me not setting the correct directory for the tree. All that was needed was
output_file->cd()
before the tree constructor, as in our software we have the file initialised in another class.
There is now no memory leak. Thank you for all your comments.