Hello Rooters,
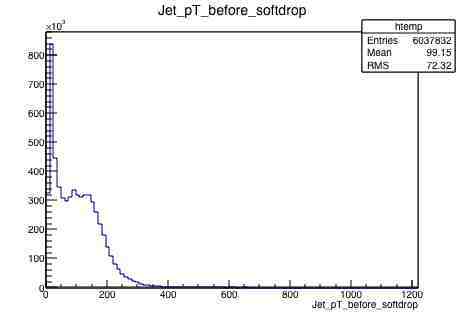
I am having an issue when trying to draw the branches of my TTree. When I view the Tree in TBrowser the branches display the distribution as expected, e.g see below.

But then when I try and run my Tree plotting macro without placing any kind of cuts a large number of the entries now occupy the zero bin. The total number that go to zero appears to be almost random and not related to the total number of events ran over in any way.
The macro that I use to produce the plot above is the following
[code]void TreePlotter(){
TFile *f =new TFile(“AnalysisResults.root”);
TList *l =(TList *)f->Get(“AliAnalysisTaskSubJetFraction_Jet_AKTChargedR100_mcparticles_pT0000_E_scheme_TCRaw_True_NoSub_Incl_SubJetRadius_0.100000_SubJetMinPt_0.000000”);
TTree *Tree=(TTree *) l->FindObject(“fTreeJetShape”);
TH1D *Hist_Tau1;
TH1D *Histogram_Tau1;
TCanvas *Canvas_Tau1;
TString Variable="Jet_pT_before_softdrop";
Hist_Tau1= new TH1D("h1JetpT","h1JetpT",20,0,1);
Canvas_Tau1= new TCanvas("c_JetpT","c_JetpT",400,400);
Tree->Draw("Jet_pT_before_softdrop >> JetpT","");
//Histogram_Tau1=(TH1D *)gDirectory->Get("h1SubJettiness456");
//Histogram_Tau1->Sumw2();
}[/code]
I see now reason why viewing the branch in TBrowser should have any effect on the distribution compared to drawing it as above. Any help on this would be greatly appreciated.
Thanks,
Harry