TTree Draw special function Sum$ not working as expected

I’m trying to draw a branch with specific cuts to be able to show ‘efficiency’ for a specific ID. When drawing my tree, I hope to draw the efficiency for a specific ID by summing the total that have a “pass” branch set to true over all entries that match the given ID. However, TTree:Draw() seems to ignore the second Sum$ special function when I use it. A code snippet is provided below that I created to illustrate my issue.

void temp(){
  TCanvas *c = new TCanvas("c", "Histogram Canvas");
  Bool_t pass;
  Int_t run;
  Int_t ID; //Here ID is a stand-in for a specific chamber. 
  TTree *tree = new TTree("EffTree", "EffTree");
  tree->Branch("Pass", &pass, "Pass/O");
  tree->Branch("ID", &ID, "ID/I");
  tree->Branch("Run", &run, "Run/I");

  run = 5;
  ID = 1;
  for (int i=0; i<100; i++){
    pass = (i<25);
    tree->Fill();
  } // Only 25/100 entries have pass=true.

  tree->Draw("Run", "Sum$(Pass && ID == 1)", "TEXT"); //This fills Run 5 with 25.
  c->Print("pass.pdf");
  tree->Draw("Run", "Sum$(ID==1)", "TEXT"); // This fills Run 5 with 100.
  c->Print("total.pdf");

  // I expect this to fill Run 5 with (number passed)/(total with that ID) = 25/100 = 0.25.
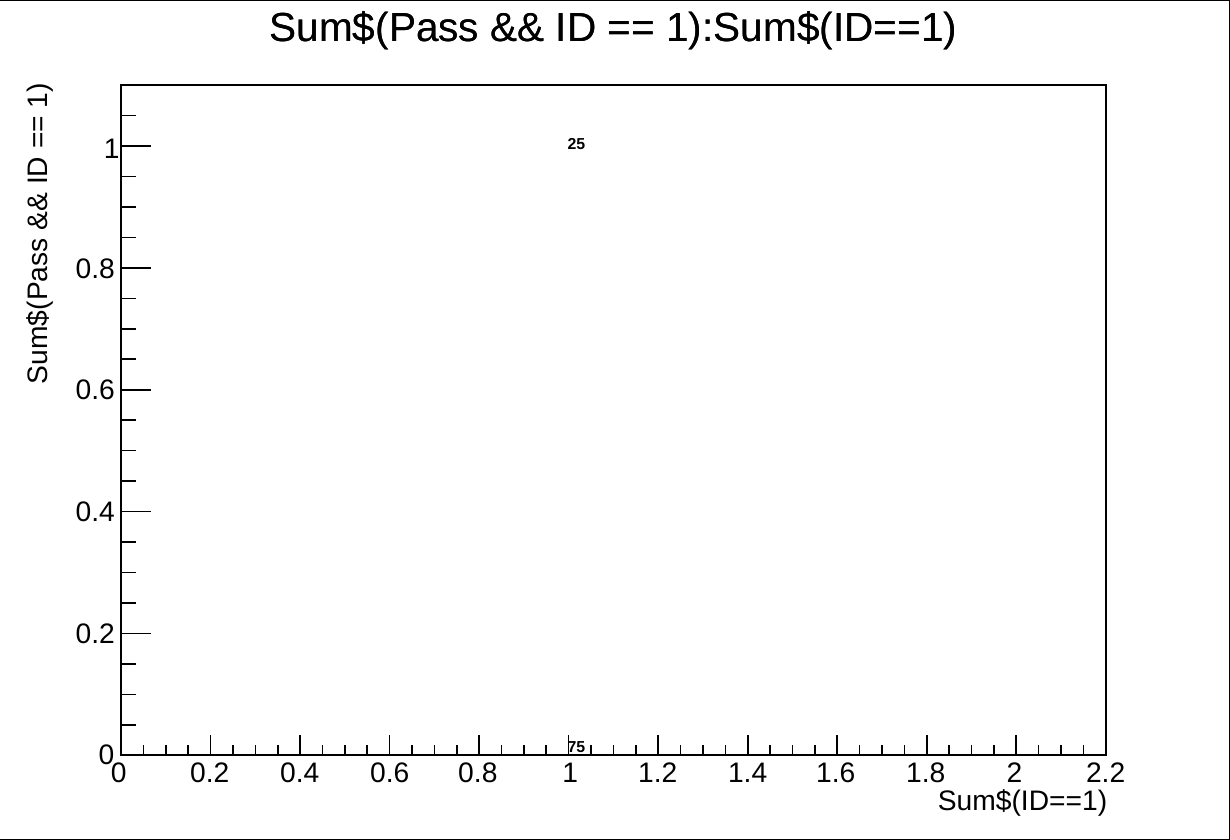
  tree->Draw("Run", "Sum$(Pass && ID == 1)/Sum$(ID==1)", "TEXT");
  c->Print("eff.pdf");

  c->Close();
}

As my comments above show, I expect the third plot I create to print the efficiency (or total passed entries over total entries). However, the third plot is always identical to the first plot. The selection seems to ignore the second Sum$ entirely. Replacing the second Sum$ with 100.0 works perfectly, so I am not sure why it is not working here.


Please read tips for efficient and successful posting and posting code

ROOT Version: 6.26/06
Platform: macosx64


Hi,

The Sum$() is expected to return the sum of an array variable within a single event.
And is not supposed to calculate the Sum of variables across many events, as far as I know.

You can see it if you plot both values as a 2D graph:

tree->Draw("Sum$(Pass && ID == 1):Sum$(ID==1)", "", "TEXT");

You can see they are both either 0 or 1 for every event. But they are filled 100 times, as the loop over TTree runs.

Note that the second argument for the Draw() function is expected to be the weight for the entry to the histogram. ttree->Draw(expression, weight/selection).
So, it actually tries to evaluate weight for each entry separately and thinks of the Pass and Id not as an array for many entries, but as a single values for this specific event.

Coming to your examples:

tree->Draw("Run", "Sum$(Pass && ID == 1)", "TEXT"); //This fills Run 5 with 25.

You fill the histogram with the value Run and give this entry a weight
Sum$(Pass && ID == 1), which for a single entry is always either 1 (entry is filled) or 0 (ignored)
It is equivalent to

for (int i=0; i < tree->GetEntries(); i++){
    tree->GetEntry(i);
    histo->Fill(Run*(Pass && ID == 1)) // Sum doesn't do anything as it is just a number
}

As you can see this ttree->Draw() business might be very confusing :wink: and it gets even more confusing when you have to deal with many variables, including array ones.

I would strongly suggest for you to try to switch to the RDataFrame, which is more recent, less confusing and with ongoing development, compared to tree->Draw().

Your example would change as follows:

void temp(){
  TCanvas *c = new TCanvas("c", "Histogram Canvas");
  Bool_t pass;
  Int_t run;
  Int_t ID; //Here ID is a stand-in for a specific chamber. 
  TTree *tree = new TTree("EffTree", "EffTree");
  tree->Branch("Pass", &pass, "Pass/O");
  tree->Branch("ID", &ID, "ID/I");
  tree->Branch("Run", &run, "Run/I");

  run = 5;
  ID = 1;
  for (int i=0; i<100; i++){
    pass = (i<25);
    tree->Fill();
  } // Only 25/100 entries have pass=true.

  ROOT::RDataFrame df(*tree);

  auto passed = df.Filter("Pass && ID == 1").Count();
  auto total = df.Filter("ID == 1").Count();
  std::cout<<"My efficiency is "<<100.*passed.GetValue()/total.GetValue()<<"%."<<std::endl;

}

I see, so Sum$ is only summing that entry. Then my third plot would just be plotting 1.0/1.0 25 times. Is there not a way to plot each run bin with its respective efficiency within a TTree’s functionality? I may move to RDataFrame if that’s the case.

The closest to your example I can think of is this.
This looks not “within TTree functionality” as much as previous example.
But this is what TTree->Draw() does in the end anyway
It creates temporary histogram and plots it. Here I just explicitly specify to dump the information not in the temporary histogram, but in my specific histogram, which I can divide later.

    TH1F* h_pass = new TH1F("h_pass", "Passed events", 10, 0, 10);
    tree->Draw("Run>>h_pass", "Pass && ID == 1", "TEXT"); //This fills Run 5 with 25.
    c->Print("pass.pdf");

    TH1F* h_total = new TH1F("h_total", "Total events", 10, 0, 10);
    tree->Draw("Run>>h_total", "ID==1", "TEXT"); // This fills Run 5 with 100.
    c->Print("total.pdf");

    // I expect this to fill Run 5 with (number passed)/(total with that ID) = 25/100 = 0.25.

    TH1F* h_eff = new TH1F("h_eff", "My efficiencies; Run; Efficiency (%);", 10, 0, 10);
    h_eff->Divide(h_pass, h_total);
    h_eff->Draw();
    c->Print("eff.pdf");
    c->Close();

Note 1:
ttree->Draw() is a nice tool if you need to quickly plot some variable for a cross-check. But don’t rely on it to do the whole analysis chain for you… I don’t think it is well suited for that…

Note 2:
Still consider moving to more modern RDataFrame :wink: The code would look very similar.
You can run it in multithreaded mode. And it doesn’t do unnecesary intermediate drawings if you don’t explicitly ask for it. And it has a lot of other neat features.

    ROOT::RDataFrame df(*tree);
    auto h_pass = df.Filter("Pass && ID == 1").Histo1D({"h_pass", "Passed events", 10, 0, 10}, "Run");
    auto h_total = df.Filter("ID == 1").Histo1D({"h_total", "Total events", 10, 0, 10}, "Run");
    TH1F* h_eff = new TH1F("h_eff", "My efficiencies; Run; Efficiency (%);", 10, 0, 10);
    h_eff->Divide(h_pass.GetPtr(), h_total.GetPtr());
    h_eff->Draw();
1 Like

This is exactly what I was looking for, thank you! Also, it’s looking like the RDataFrame might be better suited for what I’m trying to do in my actual analysis, so I’ll likely start adapting that in.

1 Like