I apologize for the repost - perhaps the original was unclear…
The behavior of TTree::Draw(“y:x>>h(…)”) has changed - in my opinion, for the worse - going from v3.10/2 to 4.00/4 as the following script can demonstrate. I use win32gdk on win2k:{
gROOT->Reset();
Int_t z;
Double_t mass;
TTree *pt = new TTree("pt","a test");
pt->Branch("z",&z,"z/I");
pt->Branch("mass",&mass,"mass/D");
TRandom r;
for(int i=0;i<1000000;i++)
{
z = i;
double mean = 100.+sin(.00001*i);
mass = r.Gaus(mean,3.);
pt->Fill();
}
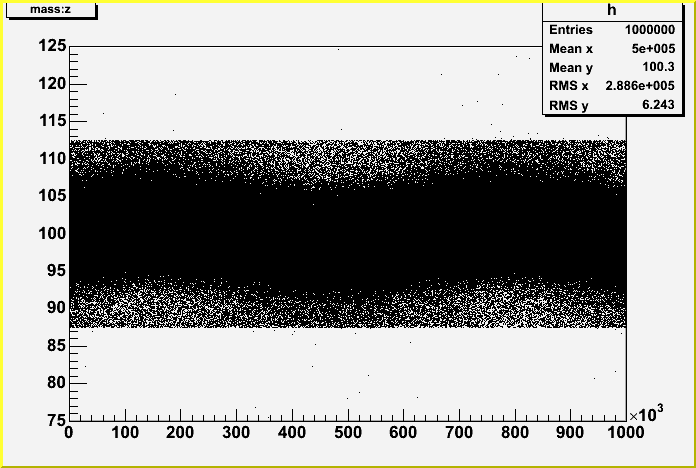
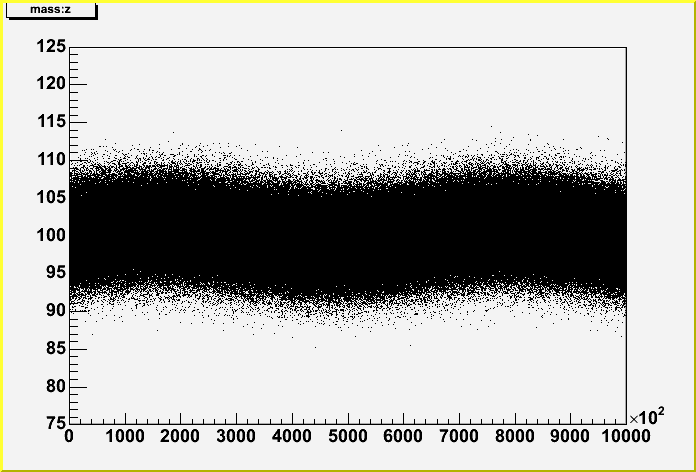
pt->Draw("mass:z>>h(40,0.,1000000.,40,0.,500.)");
}Run the script, then zoom on the y-axis, from about 75-125. The attached gifs show how my system displays the scatter plots. Is this a bug or feature? If its a feature, is there a “work-around”? Thanks!
Ed Oltman
It should work again in the CVS version
Rene
Rene,
Tested today with CVS - works great - Thanks!
Ed