Hi again you all.
Sorry to bother.
I try to draw a TTree and then add to it marker style, labels, line between points.
i use this:
[code]#include <TFile.h>
#include <TObjArray.h>
#include <TGraph.h>
#include <TObject.h>
#include <TCint.h>
#include <TGraphErrors.h>
#include <TMultiGraph.h>
#include <TMarker.h>
#include <TTree.h>
#include <TBranch.h>
#include <TFolder.h>
#include <TString.h>
#include <TH1.h>
#include <TH2.h>
#include <TCanvas.h>
#include
#include
#include
using namespace std;
void fsigma()
{
string title =“TotRunHistos.root”;
const Char_t *direction =“theta0”;
TFile *myfile =TFile::Open(title.c_str());
TTree t1=(TTree)myfile->Get(direction);
/* Float_t maxX =(Float_t)t1->GetMaximum(“energytree”)+0.5e+10;
Float_t maxY =(Float_t)t1->GetMaximum(“sigma”)+7;*/
TCanvas *c2 =new TCanvas();
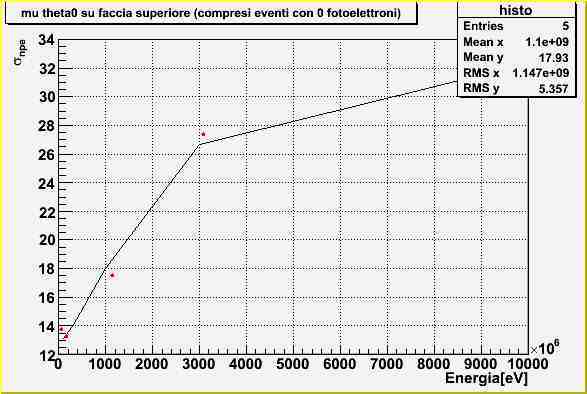
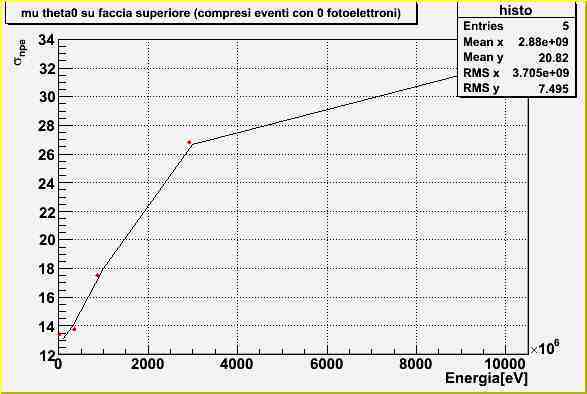
t1->Draw(“sigma:energy>>histo”,"",“lp”);
TH2D *histo =(TH2D *)myfile->Get(“histo”);//data are double
ostringstream histotitle;
histotitle<<“mu “<<direction<<” su faccia superiore (compresi eventi con 0 fotoelettroni)”;
histo->SetTitle(histotitle.str().c_str());
histo->GetXaxis()->SetTitle(“Energia[eV]”);
histo->GetYaxis()->SetTitle("#sigma_{npe}");
histo->SetMarkerColor(2);
histo->SetMarkerStyle(20);
histo->SetMarkerSize(0.4);
histo->Draw(“lsame”);
c2->SetGrid();
c2->Modified();
/delete c2;
delete histo;
delete myfile;/
}
[/code]
compiled under root with and then launched with
 .L AmirSigma.cc+
 fsigma()
why i get this histo and not what i desire (labels,grid, red points joined with a line)?
Thank you very much
Amir
AmirSigma.tar.gz (20 KB)