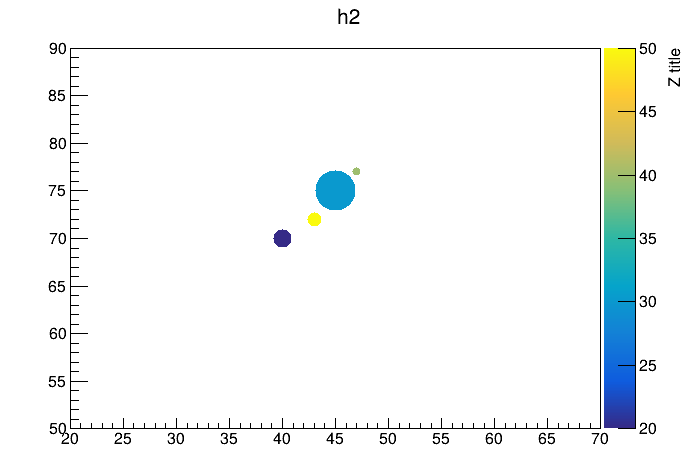
Is there a way to affect the axis range of a TScatter? For example, here’s plot that takes advantage of variable colors and marker sizes:

The only problem is that I’d like to set the axis range to (15,15) for both axes, since that’s the size of the entire detector. Right now it’s just showing the sensors that detected the photons from an event.
I tried modifying the underlying histogram:
  auto scatterHist = scatter->GetHistogram();
  scatter->GetXaxis()->SetRangeUser(-15,15);
  scatter->GetYaxis()->SetRangeUser(-15,15);
From this forum post, I gather that doesn’t work, and indeed I got the errors reported in the past:
ROOT 6.32.00: ulast > fXmax, fXmax is used message
I see that I could define a TH2 of my own, and supply it to TScatter with SetHistogram. But it’s not clear how I would specify both the markers and the colors via a TH2F.
Any ideas?
ROOT Version: 6.34.04
Platform: macosxarm64 (Mac OS 15.6.1)
Compiler: clang version 18.1.8