Tree->draw for a wider range

I am trying to plot this graph within the range between 0 and 45 on the x axis, so it should appear more narrow

image

truthTree->Draw(“mcDecMuMuY_M/1000>>M_cut5”, “mcDecMuMuY_M>15000 && mcDecMuMuY_M<22000”);

This doesn’t give me what I need:
M_cut5->GetXaxis()->Set(100,0,45)

I tried other numbers such as …Set(7,0,45), but it also didn’t work. Could you help me, please?

Hi Jozefina,

You can define histogram binning in TTree::Draw expression:

truthTree->Draw(“mcDecMuMuY_M/1000>>M_cut5(100,0,45)”, ...

Regards,
Sergey

truthTree->Draw(“mcDecMuMuY_M/1000>>M_cut5(100,0,45)”,
This still doesnt give me what i need.

I have this:
image
and I want to make it look like this:
image

You forgot to specify cut expression

And probably restart ROOT session - already created histograms will not be rebinned

Yayyyy!

Thank you!

Could you tell me what “100” stands for?

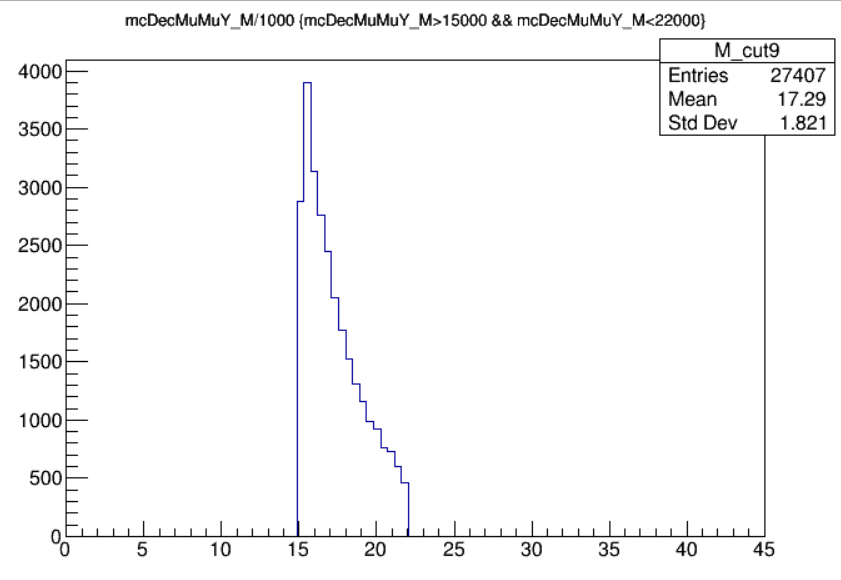
(100,0,45) is the binning specification for the histogram. 100 bins from 0 to 45.

Note that if you need to create more than one histogram, RDataFrame is more efficient although slightly more verbose: it only loops over the data once to create all histograms, while TTree::Draw loops over the data once per histogram.

With RDataFrame you would produce that plot with:

ROOT::RDataFrame df(truthTree);
auto h = df.Filter("mcDecMuMuY_M>15000 && mcDecMuMuY_M<22000")
  .Define("x", "mcDecMuMuY_M/1000")
  .Histo1D({100, 0, 45}, "x");
h->Draw();

Cheers,
Enrico

This topic was automatically closed 14 days after the last reply. New replies are no longer allowed.