Dear all,
I am trying to use TRatioPlot and encountering a lot of troubles with it.
- I want the 1st histogram to draw as points and here is and code snippet to represent what I do:
    gStyle.SetOptStat(0)

    c = TCanvas()
    t_data.Draw("tr1_n_clusters>>h_data(4,0,4)")
    t_mc.Draw("tr1_n_clusters>>h_mc(4,0,4)")

    h_data = gROOT.FindObject("h_data")
    h_mc = gROOT.FindObject("h_mc")

    h_data.Sumw2()
    h_mc.Scale(t_data.GetEntries() / t_mc.GetEntries())

    rp = TRatioPlot(h_data, h_mc)
    rp.Draw()

    h_data.SetTitle("Data e^{-} + #gamma;Number of particles in Tr1;Entries")
    h_mc.SetTitle("MC e^{-} + #gamma")
    rp.GetLowerRefYaxis().SetTitle("Ratio")

    rp.GetUpperPad().BuildLegend()

    h_data.SetMarkerStyle(20)
    h_data.SetDrawOption("PE")

    h_mc.SetLineColor(2)
    h_mc.SetLineWidth(3)

    rp.GetUpperPad().Update()
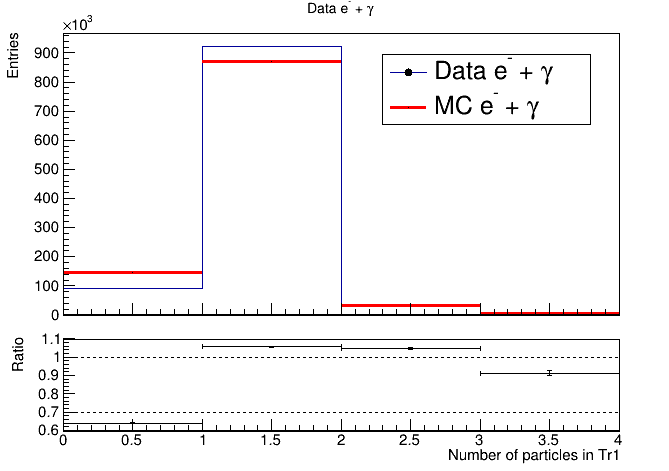
It yields histogram with no big black points as expected. Though in Legend they are present.
-
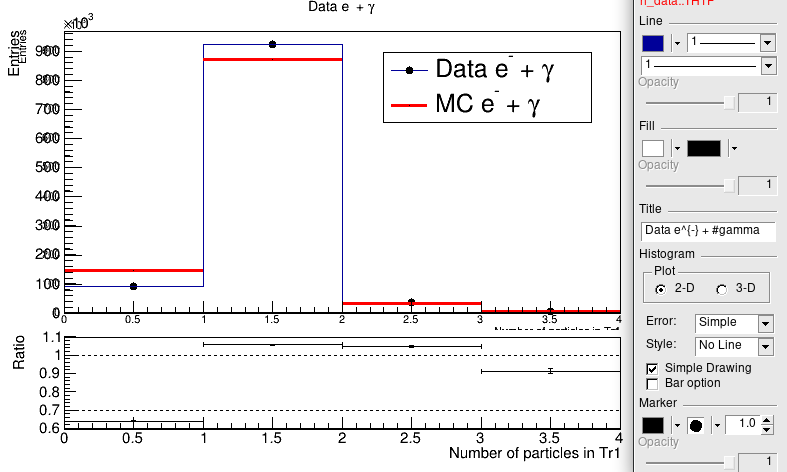
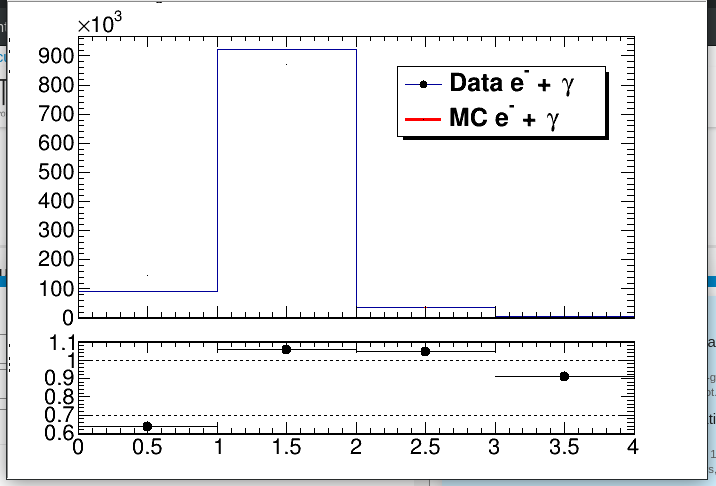
If I open SetMarkerAttributes and check “Show markers” it draws as it should, BUT if i remove the check it doesn’t return to its initial drawing.
-
If I choose in the same SetMarkerAttributes window the Error to “Simple” the plot becomes messy with double titles
- If I add
gROOT.SetStyle('ATLAS')in the beggining to the same code snippet above: The 2nd histogram loses all its style written in the code: color, line.
All the titles are too far away and invisible. While creating ratioplot by hand with ATLAS style does “ok”.
This amount of problems discovered trying to plot simple Data/MC control plots very discouraging and depressing…
Am I coding it wrong? Are these known issues? Is someone working to fix them?
Best regards,
Bohdan
ROOT Version: 6.18
Platform: SL 7
Compiler: gcc 4.8.5