I’ve got two “highly correlated” histograms, which means that their bin errors are also “highly correlated” (actually, the second one contains a “sub-sample of events” of the first one).
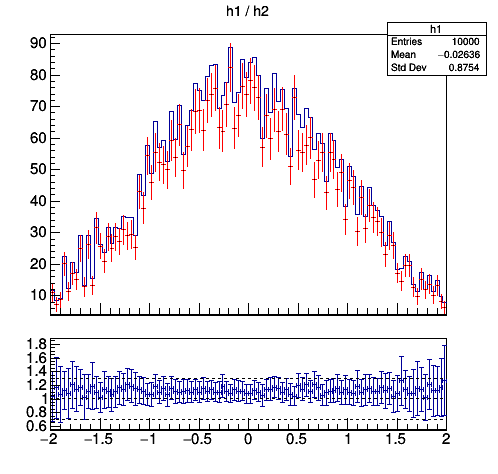
When I draw a TRatioPlot of them, I get artificially big errors for the ratios.
Could you, please, recommend any way of dealing with such situations.
The simplest macro which somehow “reproduces” this problem is:
{
  TH1D *h1 = new TH1D("h1", "h1 / h2", 100, -2, 2);
  h1->Sumw2(kTRUE);
  TH1D *h2 = new TH1D(*h1); // a copy of "h1"
  h2->SetNameTitle("h2", "h2 / h1"); h2->SetLineColor(2);
  for (Int_t i = 0; i < 10000; i++) {
    Double_t x = gRandom->Gaus(0.0, 1.0);
    Double_t w = gRandom->Rndm();
    h1->Fill(x, w); // "all"
    if (i % 10) h2->Fill(x, w); // a "sub-sample"
    // else h2->Fill(x, w); // "all", too
  }
  TCanvas *c = new TCanvas("c", "c", 500, 500); // FIRST create the canvas
  TRatioPlot *rp = new TRatioPlot(h1, h2, "divsym");
  rp->Draw();
  c->Update();
}