GeV2_NEG_PION.C (3.3 KB)
Hi,
I am trying to plot Energy deposition in transverse axis vs radius for 12 layers.
I am not getting the output as i want to. Kindly, can anyone
have a look at it.GeV2_NEG_PION.h (5.8 KB). I have attached both .C and .h files.
Thanks !!
Hello @Muhammad_Ali,
welcome to the forum!
In order to help, you would have to be more specific:
- What would you like to see?
- What do you see now?
- What did you run?
Hi StephanH,
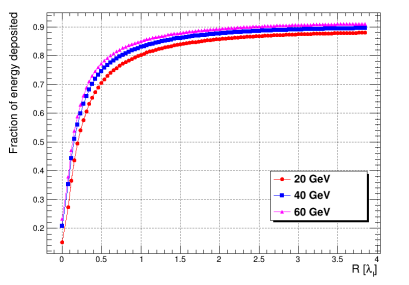
I am trying to plot energy deposition in transverse axis vs radius. I am using 12 layers of 50 x 50.
My target is to see the “energy being depositing from very beginning and after reaches a certain value it reaches plateau”. Main problem i am facing is the fact that i am not sure how can i define the function to get that kind of output. I am attaching an image what i want to see
. I hope i have explained the confusion i am facing.
Hello, it looks like what you want to do is plot a TGraph.
I can see that you are already reading values from files, so you can use the graphs tutorial as a basis for plotting the values:
https://root.cern/doc/master/gr001__simple_8C.html