Dear all,
i’ve just a simple question: why doing TH1::SetFillStyle(4050) i get always a white filled histogram even if i set fill color to something ?
Why no real color transparency ?
Thanks and cheers,
Max
Dear all,
i’ve just a simple question: why doing TH1::SetFillStyle(4050) i get always a white filled histogram even if i set fill color to something ?
Why no real color transparency ?
Thanks and cheers,
Max
see documentation of TAttFill at root.cern.ch/root/html/TAttFill.html
Rene
I’ve changed the hsum.C from the ROOT tutorials:
$ svn diff
— hsum.C (revision 27771)
+++ hsum.C (working copy)
@@ -19,9 +19,13 @@
total->Sumw2(); // store the sum of squares of weights
total->SetMarkerStyle(21);
total->SetMarkerSize(0.7);
// Fill histograms randomly[/code]re-run it with Qt plugin “on” to get the image attached
Hello Fine,
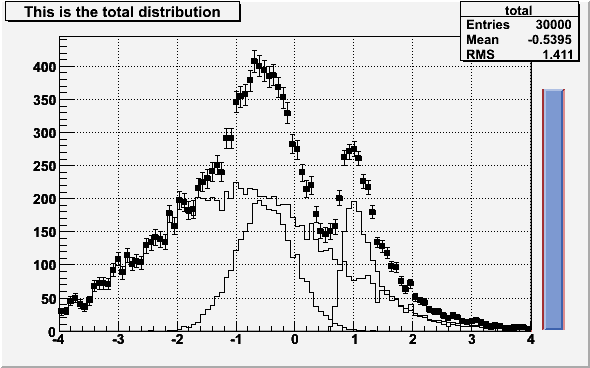
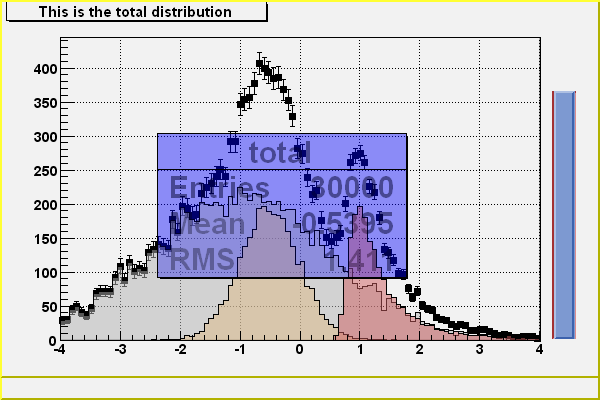
I am wondering how do you get your result. I made the same changes to hsum.C but receive only empty histograms (see plot attached). FYI: I am using 5.20/00
What version of Root did you use? May be this feature is in recent Root? Please confirm.
Having transparent histograms is very important feature and if it is finally implemented that would be great.
Best,
Yuriy
see hsum.C in the attachment with the extra line
s2->SetFillStyle(3001); //<=============================
see documentation of TAttFill at root.cern.ch/root/html/TAttFill.html
Rene
hsum.C (1.95 KB)
Hello Rene,
Thanks for your reply!
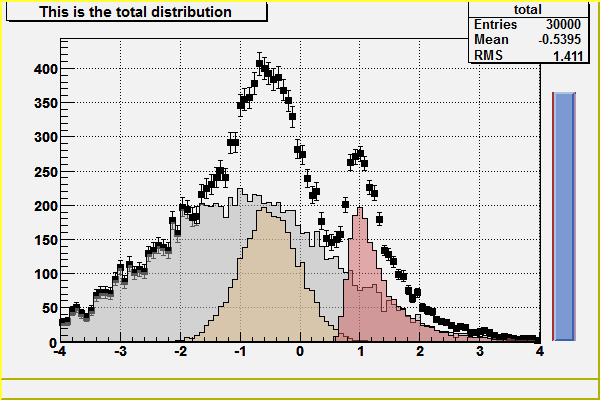
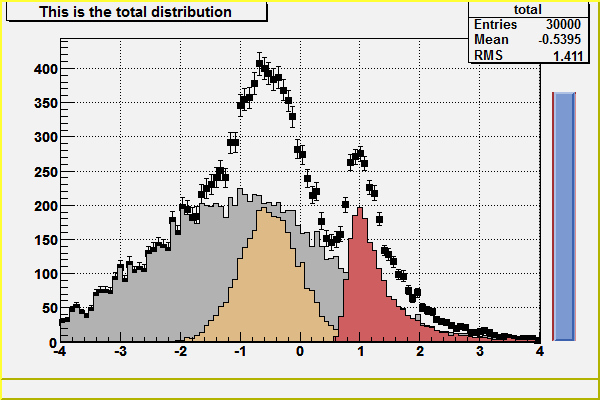
But this SetFillStyle(3001) is not exactly what I wanted. This is not true transparency but “dot pattern”. As a result if 2 histograms with FillStyle=3001 overlapped then you see only top histogram. It is illustrated in my first attachment c1.png . I applied main->SetFillStyle(3001) and s2->SetFillStyle(3001) to tutorial/hist/hsum.C . You can see that no body of main (grey) histogram is visible behind s2 (red) histogram. Only contour of main histogram is visible.
Moreover this style does not propagate to ps (or eps) format (see my second attachment c1.ps)
So, having real transparency can be useful if you want to plot 10 histograms with overlapping. That would be good if this feature finally is implemented into the Root.
c1.ps (32.8 KB)
It is portable in PS just turn off the anti-aliasing OFF as explained at the end of this page:
root.cern.ch/drupal/content/how- … -interface
Real transparency does not exists for filled area. Only for pads. As explained here:
root.cern.ch/root/html/TAttFill.html#F2
(see " for pad only").
[quote=“Yuriy”]I am wondering how do you get your result. I made the same changes to hsum.C but receive only empty histograms (see plot attached). FYI: I am using 5.20/00[/quote]I said, [quote=“Fine”]re-run it with Qt plugin “on” to get the image attached [/quote][quote=“Yuriy”]What version of Root did you use? May be this feature is in recent Root? Please confirm.
Having transparent histograms is very important feature and if it is finally implemented that would be great.[/quote]It is a feature of the Qt4-based ROOT plugin.
The plugin can be used against of any ROOT version. Qt4-based plugin is part of ROOT SVN trunk (graf2d/qt). It can be installed from CVS from BNL (see root.bnl.gov/QtRoot/How2Install4 … complement ) against of your ROOT version too. Please see another correction of hsum.C macro to demonstrate that feature can be used with any ROOT class color attribute (like fonts)[code]-- tutorials/hist/hsum.C 2009-02-12 13:03:17.013221241 -0500
+++ QtRoot/qtExamples/macros/hsum.C 2009-04-01 21:46:09.356383262 -0400
@@ -12,6 +12,10 @@
gBenchmark->Start(“hsum”);
// Create some histograms.
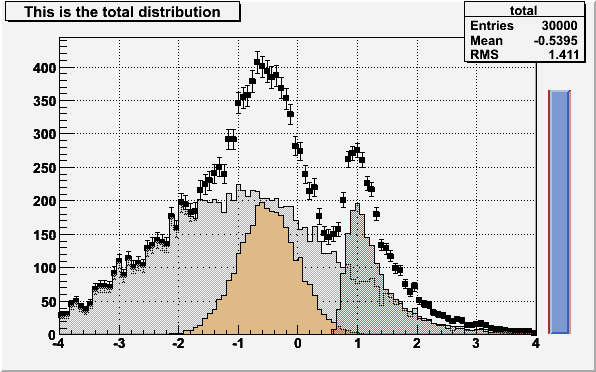
// Fill histograms randomly[/code]See: root.bnl.gov/QtRoot/pictures/hsum.font.4050.png . (The quality is defined by your local video hardware)
Hello Couet,
[quote]It is portable in PS just turn off the anti-aliasing OFF as explained at the end of this page:
root.cern.ch/drupal/content/how- … -interface[/quote]
Thank you very much for this link. It really helpful.
[quote]Real transparency does not exists for filled area. Only for pads. As explained here:
root.cern.ch/root/html/TAttFill.html#F2
(see " for pad only").[/quote]
Yes, I know this for years. Just thought if situation has changed. It seams reasonable to implement “pads transparency” to “histograms transparency”. I am not an expert in graphics, so probably there are some insuperable hindrances. This is just a rhetorical comment (sorry about that), I do not expect you to explain all details in this thread. Just want to let you know that users will be happy to have transparent histograms built-in into Root.
Hello Fine,
Thank you very much for clarifications!
So, you are using some privately made Qt plug-in. The result looks promising. I will definitely give it a shot.
Just one question. Does this transparency propagate into PS and EPS files? Thanks!
[quote=“Yuriy”]So, you are using some privately made Qt plug-in.[/quote]No, I am not. I’d said,[quote=“Fine”] Qt4-based plugin is part of ROOT SVN trunk (graf2d/qt). [/quote]See: root.bnl.gov/QtRoot/How2Install4 … complement .
[quote=“Yuriy”]Does this transparency propagate into PS and EPS files? Thanks![/quote]I have no idea  . Shall try yet. The postscript rendering is an independent
  ROOT sub-package. It has no connection with the low level GUI layers like X11, Win32Gdk or Qt. Of course, one can create Qt-based implementation
  of the ROOT postscript rendering class too. But … it is just a theory
  . None has ordered such kind of job
  .
.
[quote=“Olivier”]It is portable in PS just turn off the anti-aliasing OFF as explained at the end of this page:
root.cern.ch/drupal/content/how- … -interface[/quote]
Hello Fine,
I just tried Root with Qt4-based plug-in. I would like to confirm that I followed instruction root.bnl.gov/QtRoot/How2Install4Unix.html and everything went just fine.
Transparency works on screen and was correctly saved to PNG file. Unfortunately, as you assumed before and I just checked, transparency of histograms can not be saved to PS or EPS or PDF files. This means that the feature useful for on-screen presentation only. It can not be used to make plots for paper.
That would be great and very useful to have transparency implemented to save plots into PS (EPS, PDF) file.
[quote=“Yuriy”]Transparency works on screen and was correctly saved to PNG file. Unfortunately, as you assumed before and I just checked, transparency of histograms can not be saved to PS or EPS or PDF files. This means that the feature useful for on-screen presentation only. It can not be used to make plots for paper.[/quote]Why not. You always can create the TPad object to be large enough to produce the good paper print too  After all you can always redirect your print out to the file to get the Postscript /PDF file ( see a new attachment )
[quote=“Yuriy”][quote]None has ordered such kind of job  . [/quote]That would be great and very useful to have transparency implemented to save plots into PS (EPS, PDF) file.[/quote]Well, I am not PDF/PS expert. I guess someone has to add TPDF::SetColor(float r, float g, float b, float a) to complement the existing root.cern.ch/root/html522/src/TP … tml#XHGoTC . The googling has given me [quote]. . . Postscript doesn’t support transparency at all. In PDF, transparency was
introduced in PDF 1.4 (Acrobat 5). . . .[/quote]The link tinaja.com/glib/pstrans2.pdf sounds like ROOT PDF class can be enhanced to delivery the transparency. Probably, you can try it yourself and then send the fix to ROOT team. My understanding the vector format that supports "transparency"is SVG (well, after 5 min of googling. I may be dead wrong )
hsum_font_4050.pdf (160 KB)
[quote=“Yuriy”]This means that the feature useful for on-screen presentation only. It can not be used to make plots for paper.[/quote]I’ve created the “pdf” file from the image with the simple shell commandconvert hsum.font.4050.png hsum.font.4050.pdfTry, that works well on all platforms (Windows, Linux, MacOS). See attachment and root.bnl.gov/QtRoot/pictures/hsum.font.4050.pdf . It should be sufficient to make the plots for paper.
hsum.font.4050.pdf (23.1 KB)
[quote=“Yuriy”]Hello Couet,
. . .
[quote]Real transparency does not exists for filled area. Only for pads. As explained here:
root.cern.ch/root/html/TAttFill.html#F2
(see " for pad only").[/quote]
Yes, I know this for years. Just thought if situation has changed. . . . [/quote]It seems to me we are speaking about different things. Please, try to imagine the picture the macro below should produce and then execute it.void pads(int fillStyle=4050) {
TCanvas *c1 = new TCanvas;
TPad *p1 = new TPad("p1","p1", 0.1,0.1, 0.6, 0.6, kBlue);
TPad *p2 = new TPad("p2","p2", 0.3, 0.3, 0.8,0.8, kRed);
p1->SetFillStyle(fillStyle);
p2->SetFillStyle(fillStyle);
p1->Draw();
p2->Draw();
}
There is support now for transparent filled (solid) areas also in the pdf output without needing to convert anything.
Just use histo->SetLineColorAlpha() and no fill style.
The transparency still doesn’t work when compiled as executables and use SaveAs(“xxx.png”). It doesn’t have the -n option like when running a macro.
Which root version are you using ? can you post a example showing the problem ?
Oops. Sorry I was meant to post it on Transparent plot, instead. Will put a possible example code over there. And pardon my late reply too.
Edit: the post was too old. So I think I shouldn’t revive it.
Hi Fine,
I am considering how would you get your outcome. I made similar changes to hsum.C however get just vacant histograms (see plot appended). FYI: I am utilizing 5.20/00
What variant of Root did you use? May be this component is in ongoing Root? It would be ideal if you affirm.
Having straightforward histograms is essential element and in the event that it is at long last actualized that would be extraordinary.
Best,
Yuriy