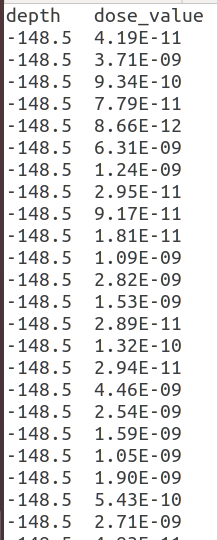
the .txt file contains 763693 line, and two column (the 1st depth varies between -148.5 and 148.5 , and the 2nd dose values).
I want to plot by root the dose versus on depth. my questions how I can convert the dose values, we must devise each dose value by the maximum value and multiply to 100.
thank you for your answer, if I understood your answer, I would read this file.txt and the converted by python has a file in ((/ max) * 100). or do you mean to convert the dose values from the source code (geant4) that I used to simulate the dose
You can start from your .txt file and you read it with RDataFrame. You define a new column whose formula is / max * 100 (provided that you found the max beforehand).
If this seems complicated, you can also read the txt file yourself (for example, from Python, which has good libraries for CSV reading) and use ROOT to do the plot.