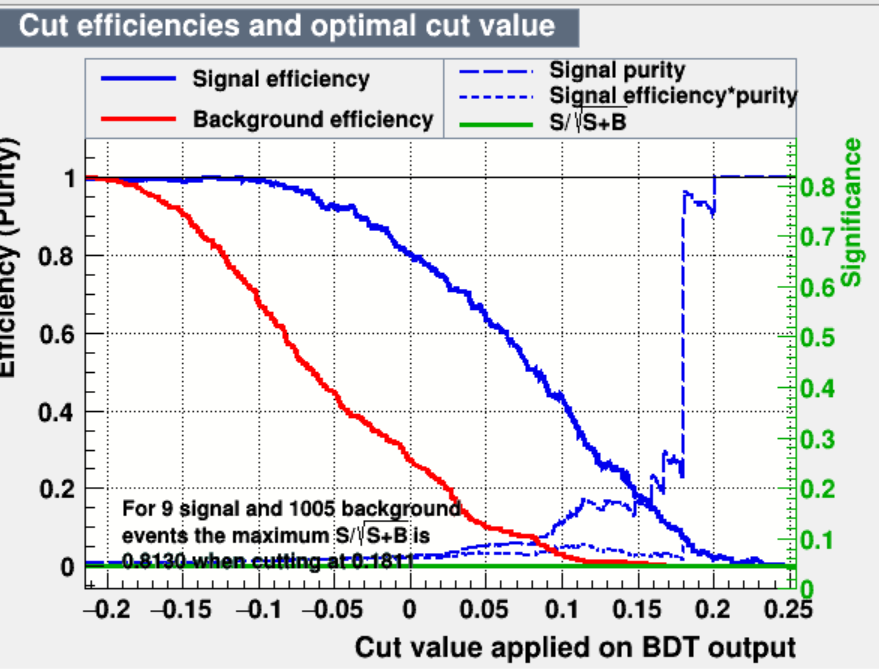
While using TMVA Gui to get the result of the BDT training, the significance line in the cut efficiency plot seems very strange(flat ). but the text in the left lower corner seems correct. Could any one please tell me what could cause it?
I tried to comment out the dataloader->SetSignalWeightExpression and dataloader->SetBackgroundWeightExpression, then the cut efficiency plot seems fine
Hi,
It is very strange that you get a flat curve for the significance (greeen curve) not consistent with what written in the test.
One thing suspicious is that you have a very small number of signal events, 9. This could maybe cause a wrong computation of the curve.
I would need to have access to your output classification ROOT file (the input to the TMVA Gui) to understand exactly what is happening
I guess I might have found what the problem is myself.
In the TMVA plotting tmvaglob.C code, in the StatDialogMVAEffs::UpdateSignificanceHists(), it doesn’t check if the significance is normal before fill the significance histogram, so I changed info->sSig->SetBinContent( i, sig ); to if (!isnan(sig)) info->sSig->SetBinContent( i, sig ); then the significance line seems fine.