Hey there,
I’m trying to plot multiple histograms on the same canvas, but I don’t know, how I can set a different axis for a plot on a TMultiGraph. What I want to do is to adjust a point of a histogram to a given axis.
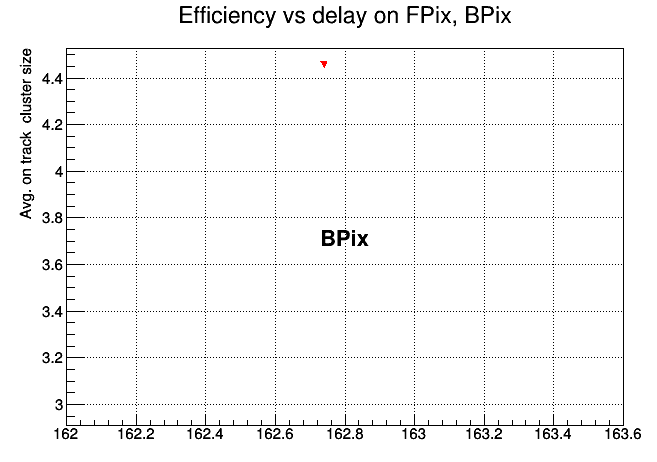
This example shows problem:
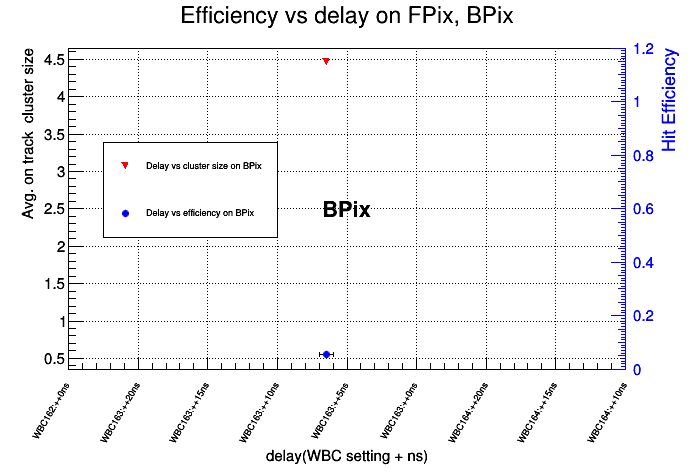
The blue marker should be adjusted to the blue axis, but it is still adjusted to the black one, I tried setting the range of the axis on the added graph, but it did not help. I also tried drawing two different graphs and adding “SAME” to the draw options but that generated a completely messed up graph.
How do I fix this?
Cheers,
Adam Hunyadi