hi, im wonder how to set the entry option so that it shows the markerstyle as well,
also for option ‘l’ here how do i set the colour of the line?
{
gROOT->Reset();
gStyle->SetOptStat(0);
TCanvas *c1 = new TCanvas("c1","multigraph",200,10,700,500);
c1->SetGrid();
// draw a frame to define the range
TMultiGraph *mg = new TMultiGraph();
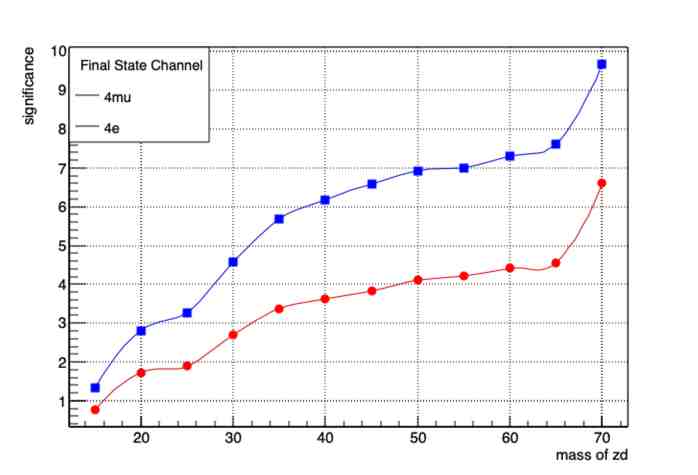
// create first graph 4mu (value of siginificance 2 poisson)
Int_t n1 = 12;
Double_t x1[] = {15.,20.,25.,30.,35.,40.,45.,50.,55.,60.,65.,70.};
Double_t y1[] = {1.34014,2.80971,3.273, 4.56457,5.68444, 6.17579, 6.59294, 6.93122, 7.00537, 7.31122,7.62571,9.6661};
TGraph *gr1 = new TGraph(n1, x1, y1);
gr1->SetLineColor(kBlue+1);
gr1->SetMarkerColor(kBlue);
gr1->SetMarkerStyle(21);
mg->Add(gr1);
// create second graph
Int_t n2 = 12;
Double_t x2[] = {15.,20.,25.,30.,35.,40.,45.,50.,55.,60.,65.,70.};
Double_t y2[] = {0.773935,1.73089, 1.88757, 2.69389, 3.37225,3.63244, 3.81842, 4.10579, 4.21114, 4.41434, 4.56194, 6.59822};
TGraph *gr2 = new TGraph(n2, x2, y2);
gr2->SetLineColor(kRed+1);
gr2->SetMarkerColor(kRed);
gr2->SetMarkerStyle(20);
mg->Add(gr2);
mg->GetXaxis()->SetTitle("mass of zd");
mg->GetYaxis()->SetTitle("significance");
mg->Draw("ACP");
TLegend *leg = new TLegend(0.1,0.9,0.3,0.7);
leg->SetHeader("Final State Channel","C");
leg->SetTextSize(0.12);
leg->AddEntry("gr1","4mu","l");
leg->AddEntry("gr2","4e","l");
leg->Draw();
c1->SaveAs("significance.eps");
}
thanks!
Please read tips for efficient and successful posting and posting code
ROOT Version: 6.22
Platform: mac catalina 10.15.7
Compiler: Not Provided