Hello everyone!
I have seen this many times, googled a lot and tested a lot, but I just can’t figure out the issue with the Y-axis range of a THStack.
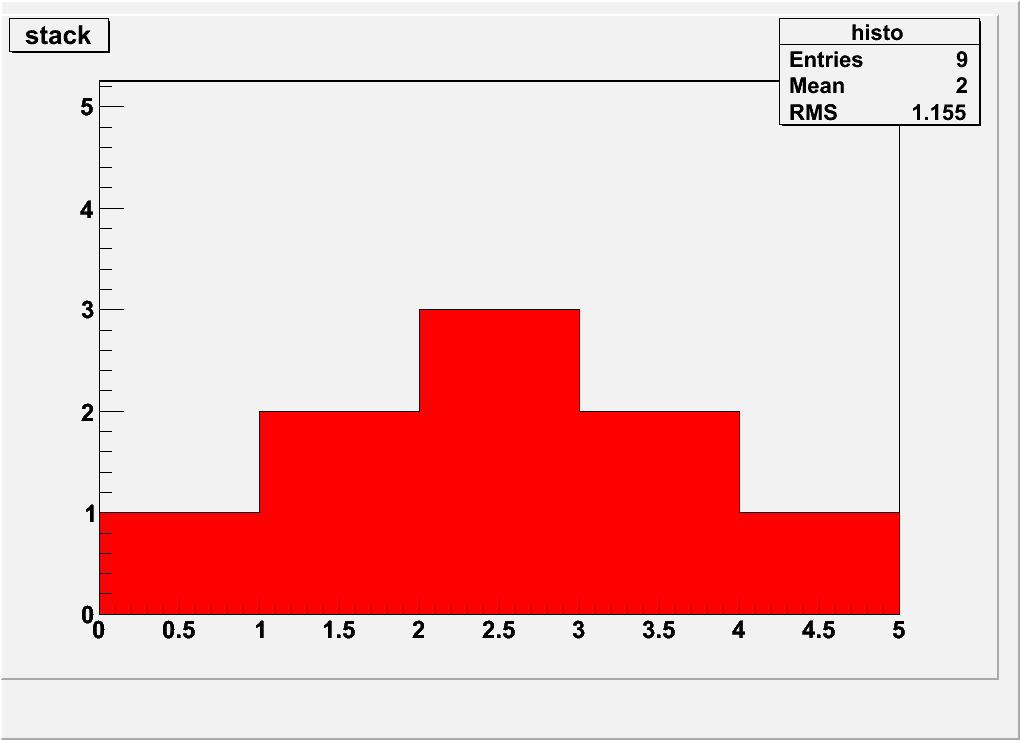
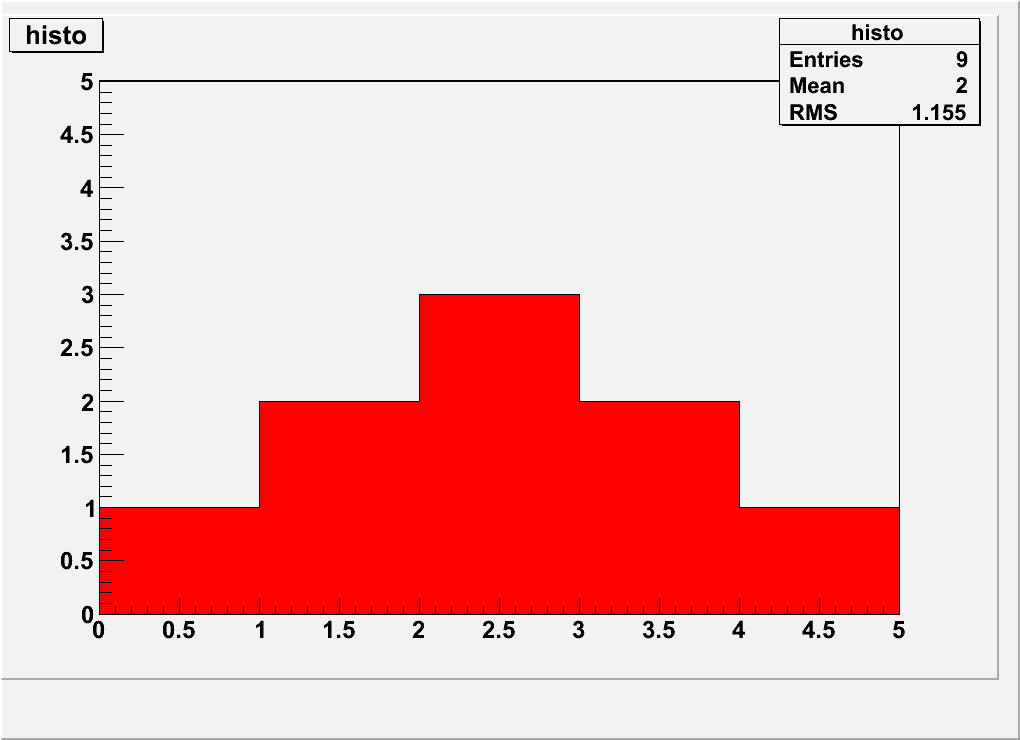
If you create two identical plots, one with a TH1F and one with the TH1F pushed into a THStack (as a simple example) and set the Maximum value for the Y-axis to the same values, the TH1F displays it correctly, but the THStack has an offset of about 5%.
I have a C++ sample running under root_v5.26.00b-linuxx8664gcc
void Minimal() {

  //Create some dummy TH1F histogram
  TH1F histo("histo","histo", 5, 0.0, 5.0);
  histo.Fill(0);
  histo.Fill(1);  histo.Fill(1);
  histo.Fill(2);  histo.Fill(2);  histo.Fill(2);
  histo.Fill(3);  histo.Fill(3);  histo.Fill(4);
  histo.SetFillColor(2);

  //Push the histogram into a THStack
  THStack stack("stack", "stack");
  stack.Add(&histo);

  //===== Create output for TH1F =====
  TCanvas c1("canvas1", "canvas1", 1024, 768);
  TPad pad1("pad1", "pad1", 0.0, 0.08, 0.98, 0.98);

  c1.cd();
  pad1.Draw();
  pad1.cd();

  //Set Minimum and Maximum for Y-axis
  histo.SetMinimum(0.0);
  histo.SetMaximum(5.0);
  histo.Draw();

  //Update, save and close
  pad1.Update();
  c1.SaveAs("histo.png");  pad1.Close();
  c1.Close();

  //===== Create output for THStack =====
  TCanvas c2("canvas2", "canvas2", 1024, 768);
  TPad pad2("pad2", "pad2", 0.0, 0.08, 0.98, 0.98);

  c2.cd();
  pad2.Draw();
  pad2.cd();

  //Set Minimum and Maximum for Y-axis
  stack.Draw();
  stack.SetMinimum(0.0);
  stack.SetMaximum(5.0);
  //stack.GetHistogram()->SetMaximum(5.0);
  //stack.GetHistogram()->GetYaxis()->SetRange(0.0, 5.0);
  //stack.GetYaxis()->SetLimits(0.0, 5.0);
  //stack.GetHistogram()->GetYaxis()->SetLimits(0.0, 5.0);

  //Update, save and close
  pad2.Update();
  c2.SaveAs("stack.png");
  pad2.Close();
  c2.Close();
}
If you run it and look at the outoputs histo.png and stack.png you see a difference. If enabling logscale its even more complicated. Does someone know or have a solution or workaround for this issue? 
Cheers
Tobias