Hi all,
I have three histograms with different x axis range.
Can I use the THStack with these histograms?
If this isn’t possible, is there a method?
Thanks
Ciccio
Hi all,
I have three histograms with different x axis range.
Can I use the THStack with these histograms?
If this isn’t possible, is there a method?
Thanks
Ciccio
You have two options “” and “nostack” when drawing THStacks.
-With the default option it does not make sense by definition to have different bin ranges
-It is ok with the “nostack” option
We show several examples in the tutorials. Look for instance at:
$ROOTSYS/tutorials/hist/hstack.C
$ROOTSYS/tutorials/hist/multicolor.C
$ROOTSYS/tutorials/math/limit.C
$ROOTSYS/tutorials/tree/cernstaff.C
Rene
[quote=“brun”]You have two options “” and “nostack” when drawing THStacks.
-With the default option it does not make sense by definition to have different bin ranges
-It is ok with the “nostack” option
We show several examples in the tutorials. Look for instance at:
$ROOTSYS/tutorials/hist/hstack.C
$ROOTSYS/tutorials/hist/multicolor.C
$ROOTSYS/tutorials/math/limit.C
$ROOTSYS/tutorials/tree/cernstaff.C
Rene[/quote]
Hi Rene,
if I use the “nostack” option, is the result differet if I use the “same” option without THStack?
Ciccio
The result will be the same with “nostack” and your own calls with “same” if your computation of the x/y boundaries are the same as THStack.
Please try with your examples to see the behaviour.
Rene
[quote=“brun”]The result will be the same with “nostack” and your own calls with “same” if your computation of the x/y boundaries are the same as THStack.
Please try with your examples to see the behaviour.
Rene[/quote]
Hi Rene,
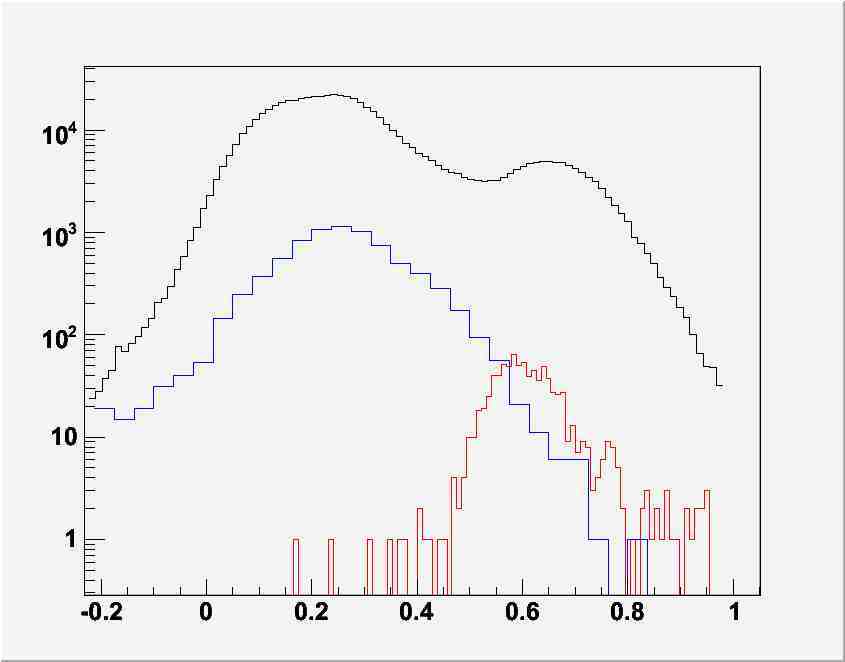
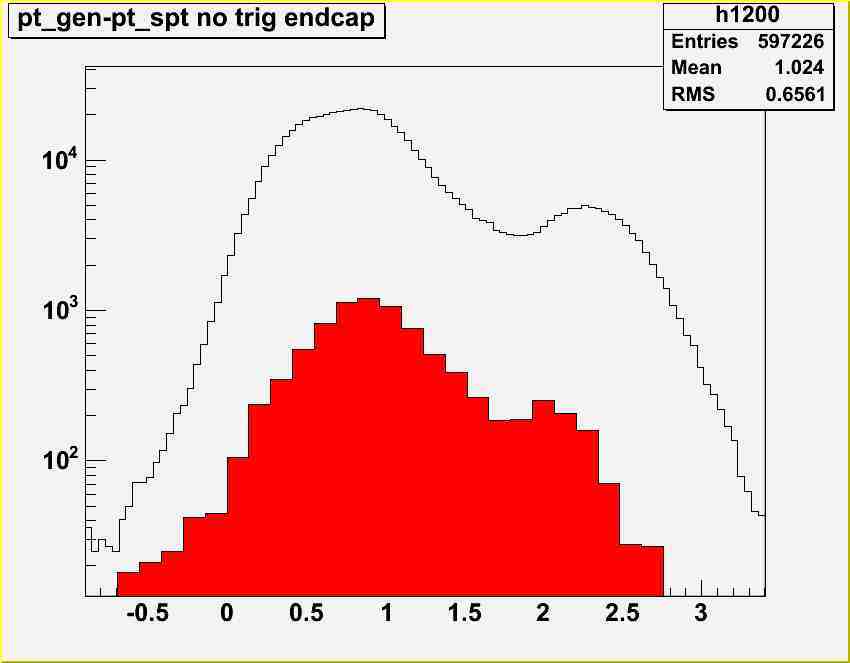
I attach the two plot, the file opt_nostack.jpg is obtained with the option “nostack” while the other is obtained with the option “same”. I would want that where the diagrams overlap they they add, also with various range
Thank
Ciccio
OK the two plots are correct. Up to you to chose depending what you want to show.
Rene
[quote=“brun”]OK the two plots are correct. Up to you to chose depending what you want to show.
Rene[/quote]
Hi Rene,
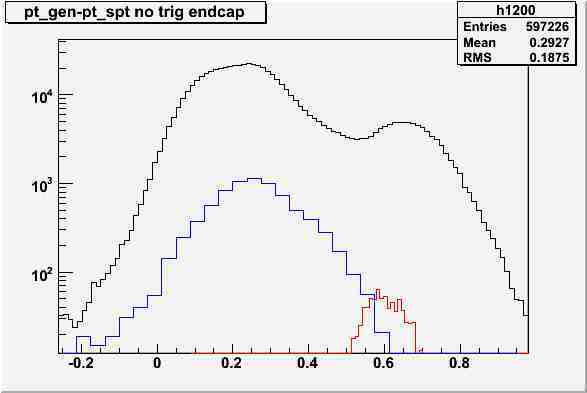
if I wanted that where the diagrams overlap they add, also with various axis range?
I attach the result, the red histogram is the union of the red and green histogram of the file opt_nostack.jpg, I want that this have two color.
Thank
Ciccio