The following is a hist tutorial ROOT: tutorials/hist/ratioplot5.py File Reference
import ROOT

ROOT.gStyle.SetOptStat(0)

c1 = ROOT.TCanvas("c1", "fit residual simple")
h1 = ROOT.TH1D("h1", "h1", 50, -5, 5)
h1.FillRandom("gaus", 2000)
h1.Fit("gaus")
h1.GetXaxis().SetTitle("x")
h1.GetYaxis().SetTitle("y")

rp1 = ROOT.TRatioPlot(h1)
rp1.SetConfidenceIntervalColors(ROOT.kBlue, ROOT.kRed)
rp1.Draw()
c1.Update()
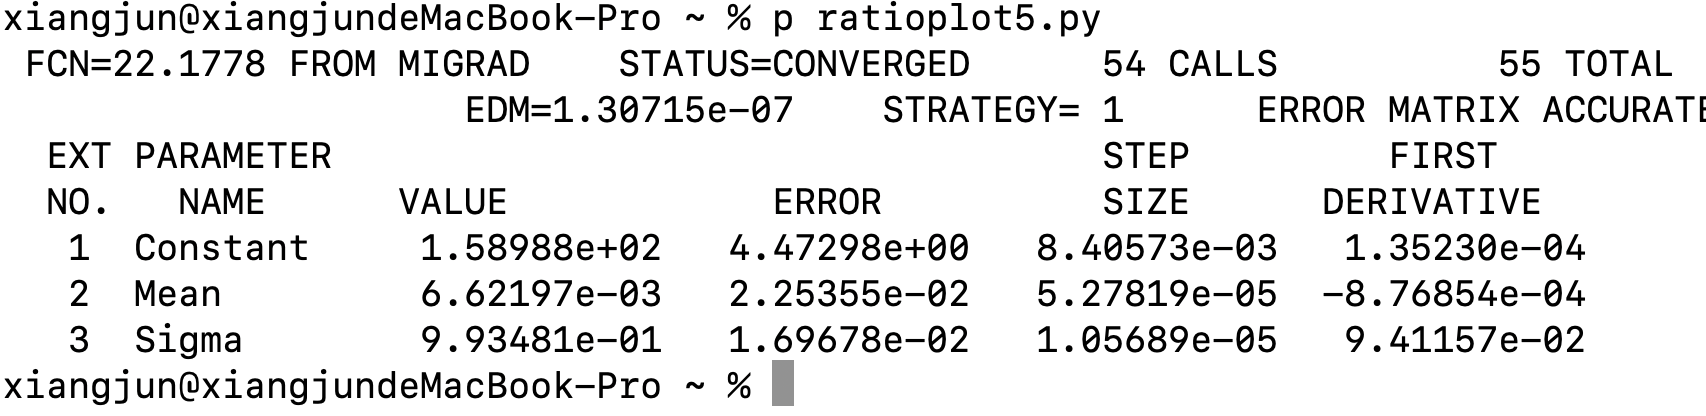
When I ran it ,I didn’t get the picture shown,just like this
p is the abbreviation for “python”
But if I add c1.SaveAs("123.pdf") ,I will get the true picture by opening it.
I don’t know the reason. there is no need to save it before.