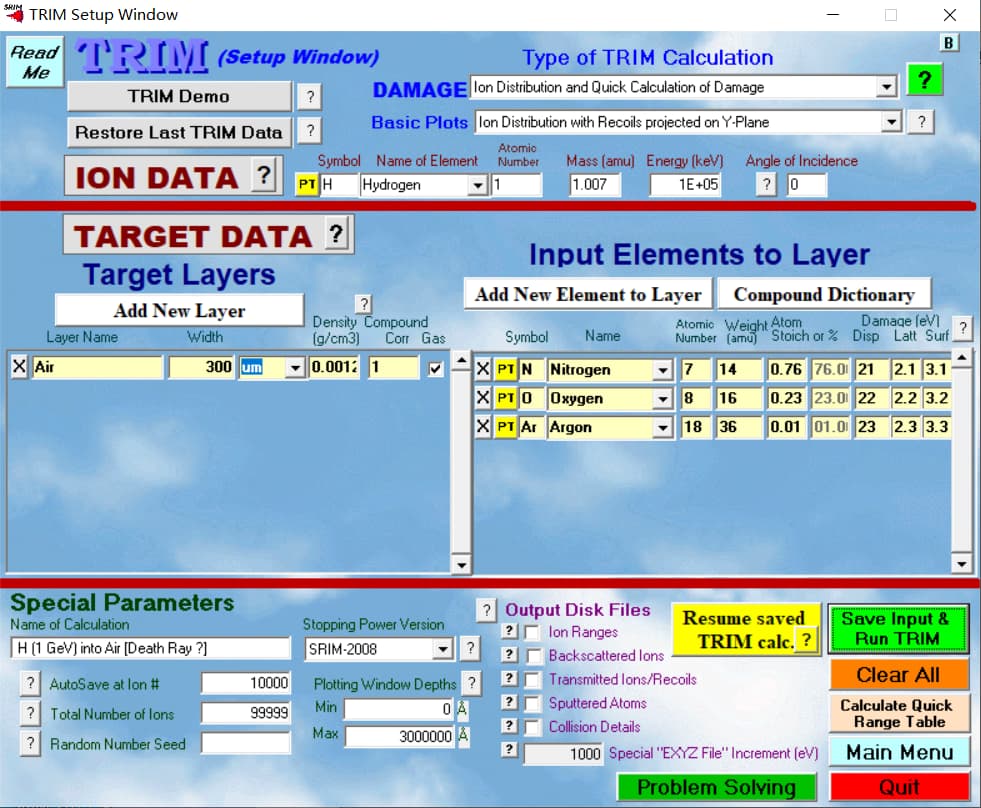
The macro looks ok to me. You will need to adjust the W value though. The value of 3.6 eV used in the TRIM example is for silicon. For air it’s about 34 eV.
At what stage does the program get killed?
I can give it a try to reproduce the issue but I’d need the gas file you are using and the EXYZ.txt file.
Hi,
Thanks a lot for your reply
I have changed the workfunction value to 30eV, but the result is still the same in the below
ComponentAnsys123::Initialise:
    Read properties of 2 materials from file MPLIST.lis.
ComponentAnsys123::Initialise:
    Read 2159067 elements from file ELIST.lis,
    highest node number: 3124105,
    background elements skipped: 0
ComponentAnsys123::Initialise:
    Read 3124105 nodes from file NLIST.lis.
ComponentAnsys123::Initialise:
    Read 3124105 potentials from file PRNSOL.lis.
ComponentAnsys123::Prepare:
    Caching the bounding boxes of all elements... done.
Killed
I will send them to your email, and thanks for your help again.
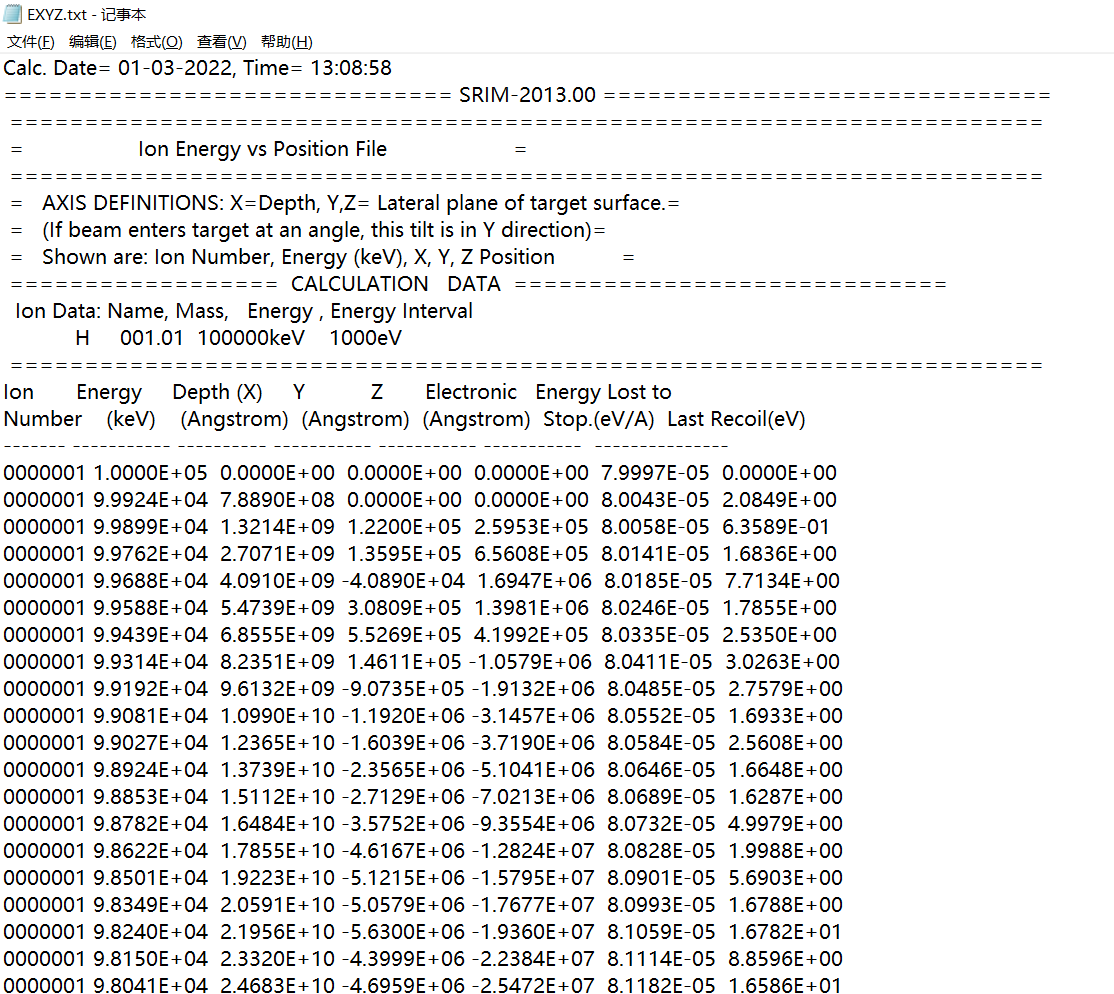
Apologies for the delay. I can’t reproduce the issue you mentioned (the process doesn’t get killed for me), but I noticed that the tracks don’t leave any clusters. Looking at the EXYZ.txt file this actually makes sense because the first point that is saved in the EXYZ.txt file for each proton at a distance of about 8 x 10⁸ Angstrom = 800 μm from the starting point of the track. Since your detector is only 300 μm or so long, the track doesn’t “see” it.
I’m a bit confused. In a previous post you mentioned that you want to simulate the Bragg peak, but the tracks in your EXYZ.txt file are several meters long…
Hi,
Thanks for your reply and help
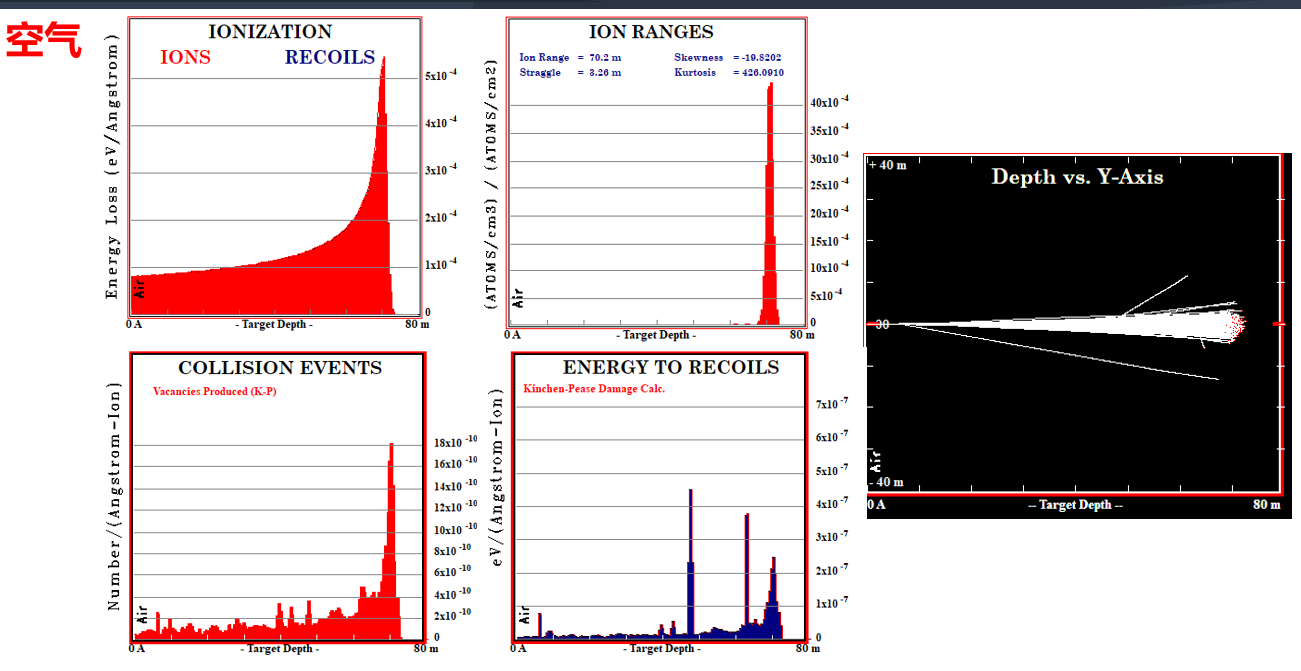
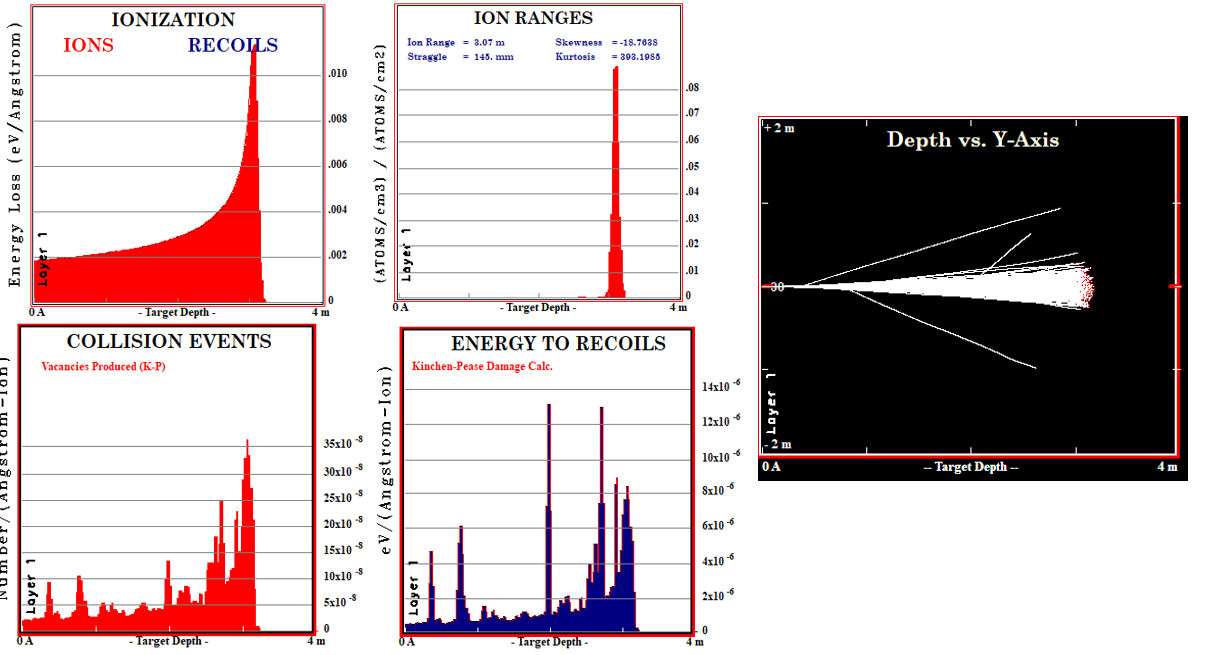
the reason seems the value of the width is not suitable, however I have tried to set the width to the value of the detector ,but the ion distribution would be empty and even the Depth-Y axis may empty too. So I think maybe my detector is too thin, the proton just pass through and run away,So I increase the width value to the biggest ion range, then the result would be got. the result like the third plot.
Hi,
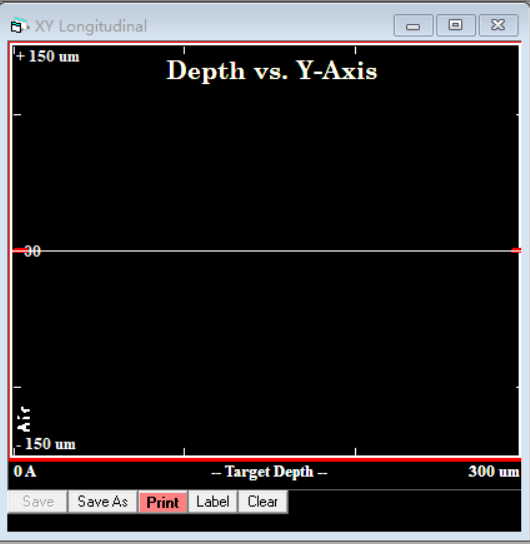
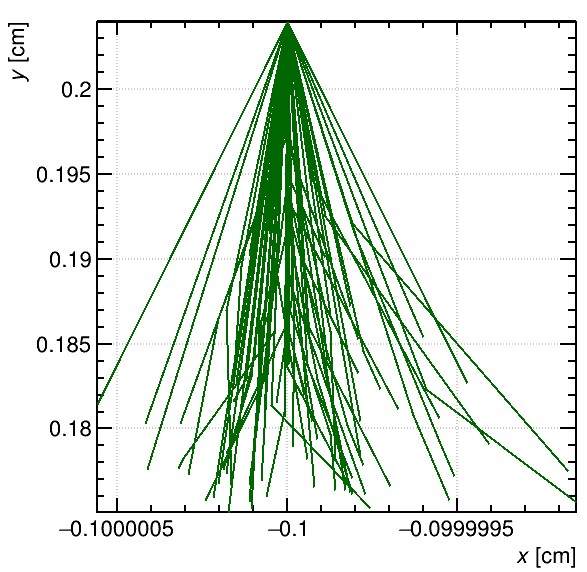
I have got the drift lines when the proton is in the P10 gas by setting the width to 300 um, the result is like the below, however then I can’t get those plots(the second plot),some would be empty or can’t be calculated. Besides,when I use the same method to generate the EXYZ.txt files to get the Garfield++ drift line, the error would notice like this:
ComponentAnsys123::PrintMaterials:
    Currently 2 materials are defined.
      Index Permittivity  Resistivity Notes
          0            1           -1 (drift medium)
          1         4.25        1e+10
MediumMagboltz::LoadGasFile:
    Reading file 4He.gas.
    Version 12.
    Gas composition set to He.
ComponentAnsys123::PrintMaterials:
    Currently 2 materials are defined.
      Index Permittivity  Resistivity Notes
          0            1           -1 He, drift medium, ionisable (drift medium)
          1         4.25        1e+10
TrackTrim::ReadFile: Read energy vs position for 100 ions.
    Initial kinetic energy set to 100000 keV.
TrackTrim::Print:
    Projectile: H, 100000 keV
    Number of tracks: 100
    Work function: 42 eV
    Fano factor: 0.17
Warning in <TCanvas::ResizePad>: Inf/NaN propagated to the pad. Check drawn objects.
Warning in <TCanvas::ResizePad>: cViewDrift_0 width changed from 0 to 10

Warning in <TCanvas::ResizePad>: cViewDrift_0 height changed from 0 to 10

Error in <TGaxis::PaintAxis>: wmin (0.000000) == wmax (0.000000)
Error in <TGaxis::PaintAxis>: wmin (0.000000) == wmax (0.000000)
Error in <TGaxis::PaintAxis>: wmin (0.000000) == wmax (0.000000)
Error in <TGaxis::PaintAxis>: wmin (0.000000) == wmax (0.000000)
Error in <TGaxis::PaintAxis>: wmin (0.000000) == wmax (0.000000)
Error in <TGaxis::PaintAxis>: wmin (0.000000) == wmax (0.000000)
Error in <TGaxis::PaintAxis>: wmin (0.000000) == wmax (0.000000)
Error in <TGaxis::PaintAxis>: wmin (0.000000) == wmax (0.000000)
Warning in <TCanvas::ResizePad>: Inf/NaN propagated to the pad. Check drawn objects.
Warning in <TCanvas::ResizePad>: cViewDrift_0 width changed from 0 to 10

Warning in <TCanvas::ResizePad>: cViewDrift_0 height changed from 0 to 10

Warning in <TCanvas::ResizePad>: Inf/NaN propagated to the pad. Check drawn objects.
Warning in <TCanvas::ResizePad>: cViewDrift_0 width changed from 0 to 10

Warning in <TCanvas::ResizePad>: cViewDrift_0 height changed from 0 to 10
Hi,
would you please help me why the other kind of gas can’t get the drift lines, I will send the gas files and EXYZ.txt file to your email, please check.
It’s really hard for me to follow what you are doing. In the program output you sent, the gas is helium, in the post you mention P10, and the gas file that you sent by e-mail is for air. Also what is the second plot that you refer to?
Anyway, the EXYZ.txt file you sent seems to be for a 300 μm thick target. Over this distance the ion loses less than 1 keV of energy, so if you look at the EXYZ.txt file you’ll see that there are only two lines for each ion, one at x = 0 and one at x = 300 μm. This is also the reason why your plot is empty. TrackTrim does not generate any clusters because both points are just outside the active volume.
You can try to reduce the energy interval at which TRIM saves points to the EXYZ.txt from 1000 eV to something like 100 eV.
Hi,
Thanks for your relpy and sorry for not making it clear.
I want to get the air, helium,P10 and nitrogen these four kinds of gas’ result. The two plot above are all about P10 which is the only result I have got. The three other gas left are all not solved with the problem “ Error in TGaxis::PaintAxis: wmin (0.000000) == wmax (0.000000)”
So I chose one problem file(the air gas) to send to you, and maybe one can be solved , the left can be solved too.
Ok, no problem. There are no clusters because the energy interval (1000 eV) in the TRIM EXYZ.txt file is too coarse for the ion energy, target density and target thickness you are simulating.
Hi,
Thanks a lot for your reply and help, I have change the energy interval at 100 eV, and it indeed works.
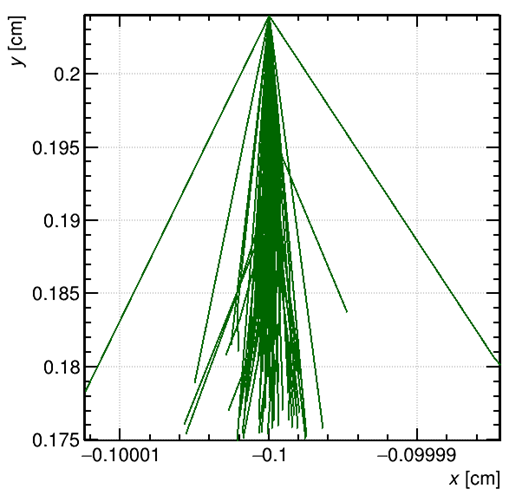
But the TRIM Depth Y axis result is not like the Garfield++ result. would you please tell me what’s the reason for that?
Hi,
Thanks for your reply
You mean that the two plots must be the same , they look different now just because their value range of the X and Y axis are not the same, am I right?