Hi all,
Is that the layout of the covariance matrix we actually create when we use these lines in fitting? This picture is for the function with 9 paremeters.
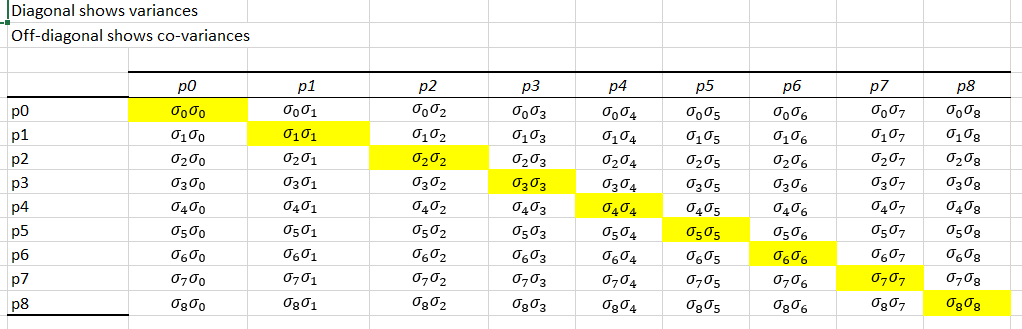
TFitResultPtr r_total = h1->Fit(total, “LRS”);
TMatrixD c_total = r_total->GetCovarianceMatrix();
c_total.Print();
If the answer is YES, then why I can’t get the same result when I use parameter errors directly from root to create my own matrix in excel in this manner?