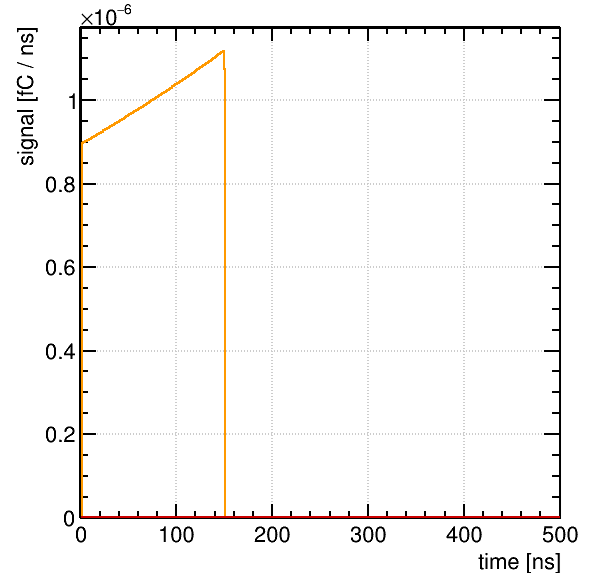
I have got the induced current generated by the proton traversing the detector based on the hschindl’s help. the result shows like the below, Does that means the biggest induced current is about 1.1 PA? And after 150 ns, the current become 0
Hi,
yes, the plot shows an electron-induced current signal with a peak value of about 1.1 pA and which stops at about 150 ns. The ion signal should be much longer, but maybe you didn’t simulate it or it’s too small to be seen on the plot.
Hi,
Thanks a lot for your reply.
How should I simulate the ion signal?
Does the plot show the situation that one proton traverse and generate one electron which produce the induced current signal result above?
You need to call DriftIon for each of the “clusters” along the track. If there is multiplication happening in the detector (i. e. if the field is high enough such that there is an electron avalanche) you should add a line drift.EnableIonTail()' to the part of your program where you set up the DriftLineRKF` object. You also need to load an ion mobility file (as discussed in an older thread).
Hi,
Thanks a lot for your reply
There is no multiplication happening in the detector , it is just in the saturation region.
So how to understand about the ion signal? Is it the signal about the positive ion in the cluster?
Yes, it’s the contribution to the induced current due to ions drifting in the gas.