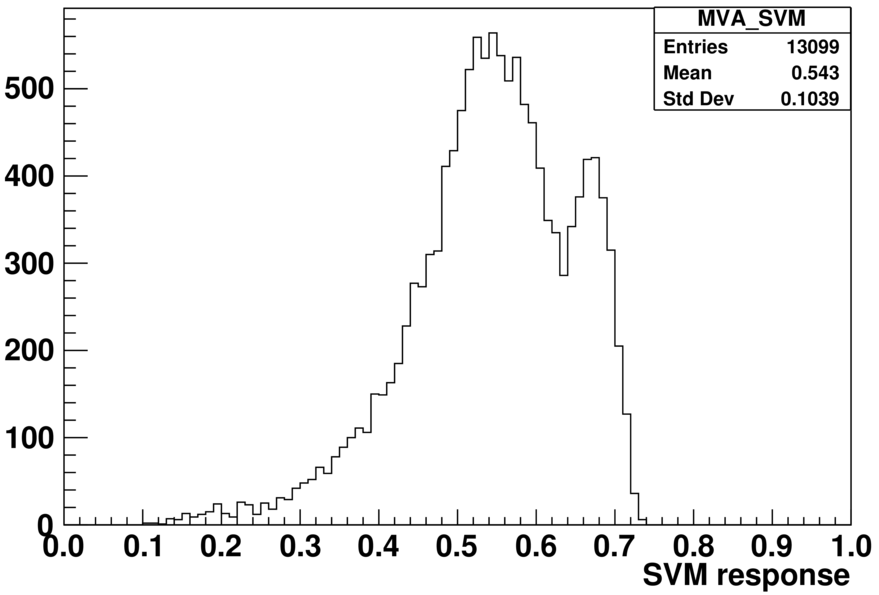
I am a beginner to learning TMVA. I am using small size samples of signal and background to do the training and testing with SVM model, and then applied the results to a large signal sample. I expect to get a similar “SVM response” distribution, however, the “SVM response” distribution from the large signal sample is quite different with the one from the training and testing.
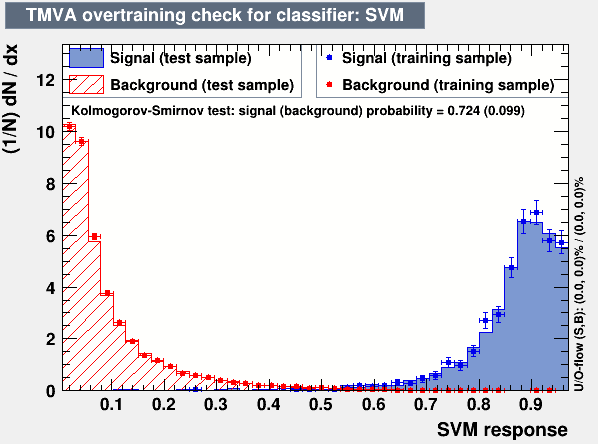
Two plots are attached here, one show the over-training check and one show the SVM response from my signal sample. Does anyone know why this happens? How can I solve this problem?
There seems to be an error with the overtraining plot, could you re-upload it?
In general: The two plots should agree if the training converged without overtraining. However, if the training and test samples are too small they need not be indicative of the true final distribution.
Can you increase the size of your training sample?
Thanks a lot for the help, I uploaded the png version. The training and test samples (together) is around 1/5 of the signal MC samples size (the 2nd plot above), it’s around 2700 events.
Is there any idea to find what is the appropriate size for the training and test samples?
The overtraining plots actually look quite good (good agreement between training and validation), this taken with the fact that (if I remember correctly) an SVM has quite few parameters indicates that overtraining should not be a problem. (A good rule of thumb is to have “significantly” more data than parameters e.g. an order of magnitude.)
This makes me wonder how exactly the second plot is generated. Could you elaborate here; Maybe there is a difference in the transformations applied to the data?
(E.g. if you use formulas in dataloader->AddVariable these must be applied manually when using the TMVA::Reader.)
Thank you for your helps and patience.
The 2nd plot above, I got it from the reader -> EvaluateMVA(“SVM method”), based on the example TMVAClassificationApplication.C. I am wondering if there any special setting the the evaluation, but didn’t find any special in the manual.
Furthermore, I even tested for my training and test samples (they are in one sample), the similar situation.
In my MVA variables, there are a few of them are integer, but in the application macro, all of them required be float variable for reader -> AddVariable(“var”, &var), is this OK?
Do I understand you correctly that you see the same problem (weird shape) when using the application on the training and test samples? If so, I think it’s time we took a look at your training and application scripts, if you’re willing/able to share.
This is ok. The integer variable type is used to optimise the training.
Yes, this is weird. It would be great if you can help me to look at the macros.
I just post parts of both macros here (the parts I modified for my works, the rest of the macros are same as in the TMVAClassification.C and TMVAClassificationApplication.C)
Sorry to disturb you again. Do you have a chance to have a look of the codes? Or is it not enough to find the problem?
I used the same samples to do the BDT training with scikit-learn in Python, and applied the results to other samples, here I can get similar BDT-response distribution as expected.
Sorry for taking so long to get back to you. I checked the code but could not find anything immediately suspicious. Might I ask you to check the output when using TMVA::Reader on only the training data?
I did also try running a few variations of the TMVAClassification.C setup based on your scripts, but for me the output is as expected. (ROOT 6.18)
Thanks for double-checking with another implementation. That narrows down the problem space quite a lot!
Could you help me how to do the TMVA::Reader on only the training data? Can I get this done in the TMVA Classification.C code?
The strange thing is, I can get a pretty good results from TMVAClassification.C, for the BDT model, and the signal distribution can reach 1.0, peaked at around 0.8.
But from the scikit-learn training, the signal distribution has maximum at around 0.8, and peaked at around 0.6. This is not really a problem, because the training options in scikit-learn are different as them in TMVA. The scikit-learn training results are applied in other independent full signal samples, I can get the similar BDT response distribution as in the training.
To run it on the training sample you can load the data from the output file of the training step. For the standard setup in TMVAClassification.C this file is called TMVA.root.
You can use rootbrowse TMVA.root to inspect the structure manually before plugging it in into the application script. There should be a TTree in there called TrainTree.