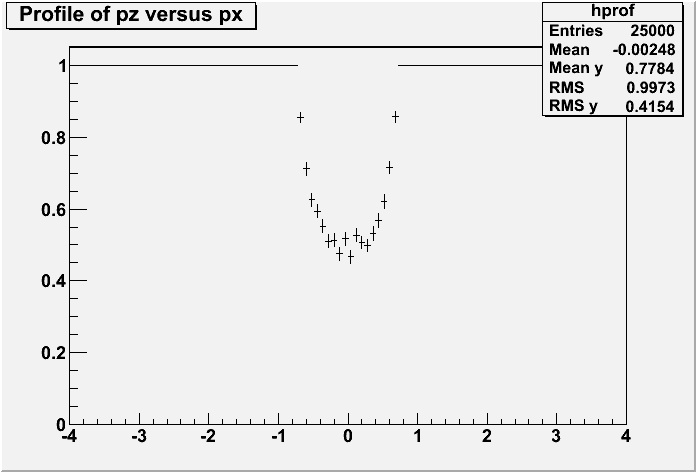
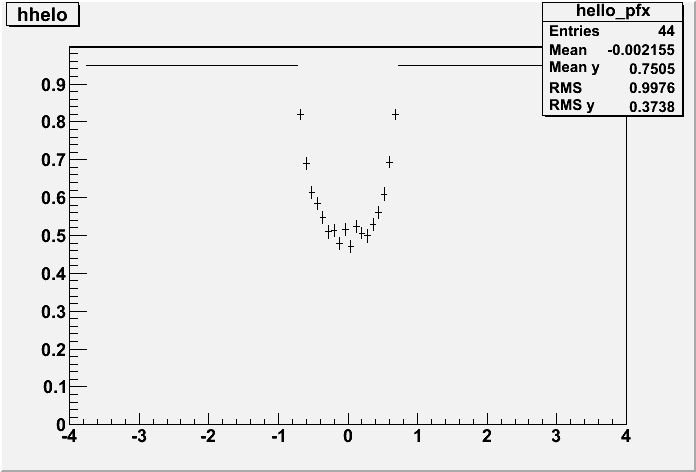
Hi everyone:
Here is a piece of code.
TH2F* f2 = new TH2F(“hello”,“hhelo”,100,-4,4,11,0,1.1);
Float_t px, py, pz;
for ( Int_t i=0; i<25000; i++) {
gRandom->Rannor(px,py);
pz = pxpx + pypy + 5;
      if (pz > 5.5){
         f2->Fill(px,1);
         hprof->Fill(px,1);
        continue;
       }

   hprof->Fill(px,0);
   f2->Fill(px,0) ;
}
TProfile* fp = f2->ProfileX();
I wonder why the plot of fp is different from hprof, especially the value of y-axial.