Well, as far as I have understood, I do not need the statistic display. I only need to draw two 2D histograms in the same canvas both with the box option. If I draw 1 2D histogram it works fine, but plotting the second histogram, I get a scatter plot with no option box which leads to the whole pad being filled with points.
I have tried to make a reduced version of the macro, and realize that the problem is not that the box option goes off, but another, puzzling thing:
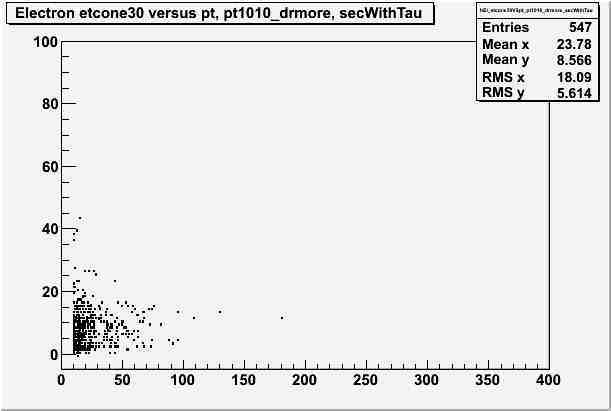
If I just draw a 2D histogram by clicking on it in a TBrowser, not choosing any draw option, the whole canvas is filled with histogrampoints. If I then, draw it again, choosing the box-option, just a small area has boxes, see attached plots.
I have seen this before without understanding why. An explanation, and solution would highly be appreciated! I don’t expect to have points everywhere in the canvas, the box-option figure looks more like what I would expect.