I am trying to duplicate hist/multicolor.C with the “text” option when drawing with little success. What I would like to do is display a correlation matrix and visually highlight any cells above 0.8.
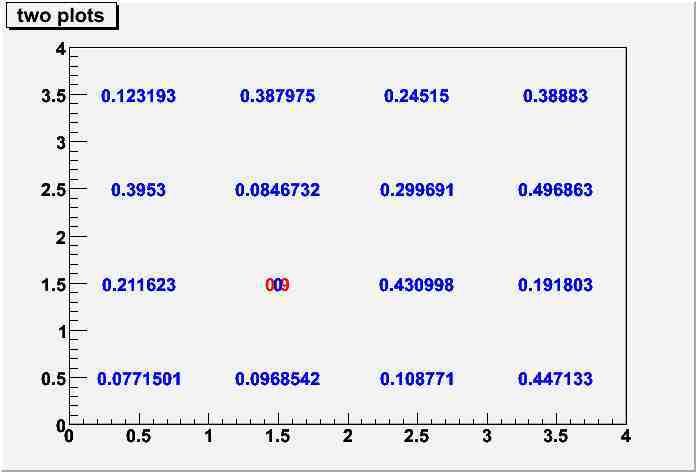
When I run the attached code with .x htest.C(0) the lego plot is fine. When I run .x htest.C(1) none of the cells change color, the numbers all look fuzzy and in cell 1,1 its hard to make out the content is 0.9. When I run with .x htest.C(2) cell 1,1 is black and I cant see my number (also I want all the other cells to be the same color which they are not).
Does someone know a better solution?
Thanks,
Sanjeev
#include "TCanvas.h"
#include "TH2.h"
#include "THStack.h"
#include "TRandom.h"

void htest(Int_t iType = 0)
{
    TCanvas *c1 = new TCanvas;

    TH2F *h1 = new TH2F("h1","h1",4,0,4,4,0,4);
    h1->SetFillColor(kBlue);
    TH2F *h2 = new TH2F("h2","h2",4,0,4,4,0,4);
    h2->SetFillColor(kRed);

    THStack *hs = new THStack("hs","two plots");
    hs->Add(h1);
    hs->Add(h2);

    TRandom r;
    Int_t i, j;
    for (i=0;i<4;i++) {
        for (j=0;j<4;j++) {
            if (i==1 && j==1)
                h2->Fill(1,1,0.9);
            else
                h1->Fill(i,j,r.Uniform(0,0.5));
        }
    }

    if (iType == 0)
        hs->Draw("lego1");
    else if (iType == 1)
        hs->Draw("text");
    else if (iType == 2)
        hs->Draw("textColZ");

    h1->SetMarkerSize(2.0);
    h2->SetMarkerSize(2.0);
}
Thanks for the quick response. This was not quite what I wanted as seen in the attached plot
If I run .x hist.C(1) after I set the the marker color, in cell (1,1) I see a 0.9 in red superimposed on a 0 in blue. In addition the text in all the other cells still looks fuzzy. Ideally I would like to change the color of the cell (1,1) to red. Is this done easily?
Thanks,
Sanjeev
#include "TCanvas.h"
#include "TH2.h"
#include "THStack.h"
#include "TRandom.h"
void htest(Int_t iType = 0)
{
TCanvas *c1 = new TCanvas;
    TH2F *h1 = new TH2F("h1","h1",4,0,4,4,0,4);
    h1->SetFillColor(kBlue);
    h1->SetMarkerColor(kBlue);
    TH2F *h2 = new TH2F("h2","h2",4,0,4,4,0,4);
    h2->SetFillColor(kRed);
    h2->SetMarkerColor(kRed);
THStack *hs = new THStack("hs","two plots");
hs->Add(h1);
hs->Add(h2);
TRandom r;
Int_t i, j;
for (i=0;i<4;i++) {
for (j=0;j<4;j++) {
if (i==1 && j==1)
h2->Fill(1,1,0.9);
else
h1->Fill(i,j,r.Uniform(0,0.5));
}
}
if (iType == 0)
hs->Draw("lego1");
else if (iType == 1)
hs->Draw("text");
else if (iType == 2)
hs->Draw("textColZ");
h1->SetMarkerSize(2.0);
h2->SetMarkerSize(2.0);
}
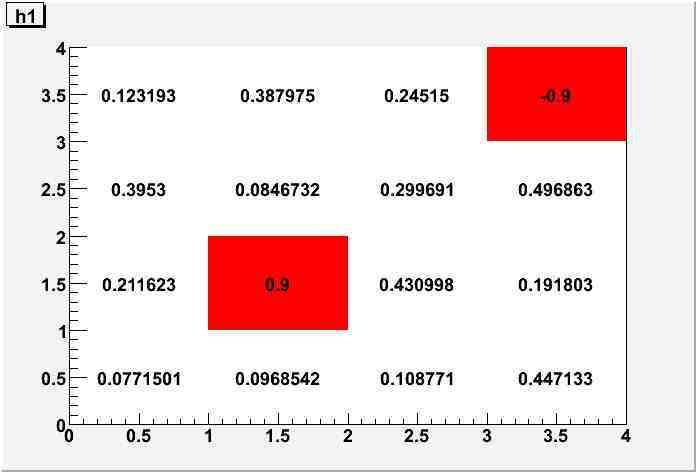
You cannot set the attributes of one single cell because there is no object associated to each cell. My suggestion is to
-in h1 set to 0 the cells that you do not want to draw with the first color
h1->SetMinimum(min) where min is the value above which you want to draw
-in h2 set to 0 all sets already set in h1
-h2->SetMinimum(min)
I wonder of there is a solution which uses the Palette which can change the color of the cells. I tried the following and wonder if I can control at what values the Palette change from blue to red? As seen in the attached plot I have a 2 red cells and would only like one at values > 0.8.
Thanks,
Sanjeev
#include "TH2.h"
#include "TRandom.h"

void htest2()
{
    TCanvas *c1 = new TCanvas;

    TH2F *h1 = new TH2F("h1","h1",4,0,4,4,0,4);
    h1->SetStats(kFALSE);
    h1->SetMarkerSize(2.0);

    TRandom r;
    Int_t i, j;
    for (i=0;i<4;i++) {
        for (j=0;j<4;j++) {
            if (i==1 && j==1)
                h1->Fill(i,j,0.9);
            else
                h1->Fill(i,j,r.Uniform(0,0.5));
        }
    }

    //--------------
    Int_t colors[2];
    colors[0]= kBlue;
    colors[1]= kRed;
    gStyle->SetPalette(2,colors);

    h1->Draw("textCol");
}