I looked at the TH1::GetRandom() code, and it seems to me that, once a bin is chosen according to the relative integrals of the bins, a value inside this bin is chosen “in proportion” to the distance of the random value between the two edges of the bin.
How does this work if the bin width are not all the same, in particular with logarithmic bins?
I have a occurring-time-delay distribution that is almost a falling exponential and it would be very convenient for me using logarithmic binning on the X axis, so that I can describe in detail the early times without thousand of bins and the tail with sparse events can be better smoothed.
I can also use equally sized bins and fill the histogram with the log10 of the times, but also in this case I am not sure if GetRandom() is correctly accounting the model.
So, if you want to use GetRandom you need first to rescale the histogram contents by dividing by the bin with to represent densities and then you can call TH1::GetRandom
The second approach, or a workaround if you prefer, is to have a source histogram with equally sized bins that is produced with the log10 of my data.
When I GetRandom() from a source histogram produced in this way, I can get again the data in the “correct space” with the power of 10 of each extracted number.
Is this a statistically correct approach?
I made my test with a simple exponential decay:
TF1 f1("f1","exp(-x)",0.,10.); f1.Draw(); //I use this to produce the "source histogram"

TH1D hmodel("","",500.,-4.,1.); //I create the model in this example using the TF1
for (int i=0; i<1000000; ++i) hmodel.Fill( std::log10(f1.GetRandom()) );
hmodel.Draw(); //this is my source histogram (I expected something flat but I was wrong)

TH1D htest("","",1000.,0.,10.); //this is the histogram to test the approach
for (int i=0; i<1000000; ++i) htest.Fill( std::pow( 10. , hmodel.GetRandom() ) );
htest.Draw(); //the histogram is an exponential !!! So it should work...
From my test it seems that the workaround works (at least for an exponential)
The approach you are doing is also correct, you should be careful to use the correct axis boundaries.
I think the advantage of using an histogram with log-binning is that you are going to have a almost flat density, which will result in a slightly better random number generation.
What do you mean exactly? Just the annoyance of calculating the axis limits (but I just log10 my linear axis min and max, correct?) … or are you warning me about some subtlety that I cannot see right now?
Hi,
I am referring to the fact that you don’t truncate the distribution, like in your example your histogram hmodel is from -4 to 1, so you are excluding the cases where the generated x < 1.E-4 , but your model is valid in [0,10]
Would it still be a statistically correct approach to add a small offset, 1e-4 in my example, to the time when I build my “model” histogram (from which I will extract random numbers)?
This can be done either with with a log10-binned histogram, or with a equal-width-bins histogram filled with the log10 of the time data. In case I can remove again the offset from the extracted numbers, but being so small I guess it is not relevant.
Hi,
I am not sure I have fully understood what you are proposing. If you are filling the histogram with a shifted distribution, you need to be careful to remove correctly from the number, and especially if you are doing a transformation from x → log(x).
yes I am trying to workaround the fact that my “source data” can have times be “arbitrarily” close to 0., and actually the closer to 0, the higher the probability. So I found out that maybe with the first “source data” (it is a GEANT4 optical simulation) my histograms minimal value can be 1ps, but when I move to next “source data” (another configuration) it should have been 0.1ps, and this can continue further on when I simulate new data.
On the other hand, I do not care to have for my ToyMC precision much better than 1 ps, because in reality the instrumental sources of errors are bigger.
So my idea would be to “push” all “source data” beyond a minimal interesting value, e.g. by adding 0.1ps, so for all cases the histograms can start from 0.1ps. This idea can be applied to the log-binned histograms approach, as well as the approach with linear binned histogram filled with the log10 of the shifted data.
When I GetRandom() from my “source histograms” I can “return” the artificial 0.1ps offset (or I can just ignore it being so small). For the approach with linear binned histograms and log10, I added it again after getting the pow(10, h.GetRandom())
Hi,
I am not sure I have followed well your reasoning. I don’t understand why you prefer doing that transformation. It is much better to fill a variable bin histograms where you choose the bins according to your distributions, and probably not smaller than 1 ps and then you generate from that histogram directly.
You need only to transform in a density before calling TH1::GetRandom by dividing the content (number of counts/bin) by the bin width.
I managed as you suggested and I like the fact that now I read my x-axis in ns rather than non-obvious exponents.
However I had to face an additional problem (which became apparent after changing to your suggestion) due to the fact that each PMT is reached after a travel time that depends on the per-PMT distance from the starting point: this time offset (order of few ns) jeopardizes the effort I did to have fine binning where needed, because everything shifts into a bunch of thicker bins.
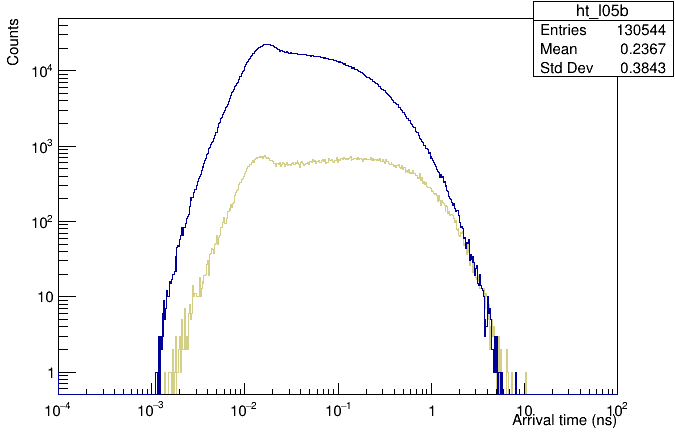
So I have no choice and I have to subtract this time offset on a PMT basis. Luckily this is possible because I generate GEANT4 simulated data starting photons always from a fixed position (with a small radius): I can calculate in advance the geometrical minimal possible travel time per PMT and subtract this value before filling the histograms. You can see that now all histograms enjoy the fine binning
Of course in the second step, i.e. my toyMC that combines times from more PMTs to find the fastest response, I have to add again the offsets before time comparison, so I have to keep track (i.e. saving in the ROOT file) also of the used offsets.
It is not hard and I have already implemented it in this way, but I wonder if, to keep all the information in the same source, I can shift the logarithmic bin edges by this time offset on a PMT/histogram basis. Bin widths remain the same (*), so densities can still be obtained and I guess that also correct probabilities will be ensured. It would be similar to add a second “graphical” axis, with the advantage that I can overlap histograms and visualize immediately the different travel time among PMT.
Is there any flaw with this?
Thanks in advance,
Matteo
(*) just not sure about the first bin… have to think more