Hey Guys,
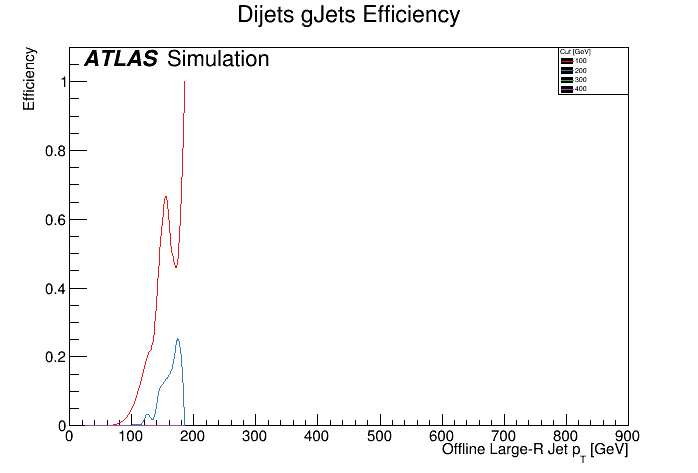
I am making some efficiency curves and my plots are coming out really weird with the TGraphAsymmErrors class. The x-axis should run to about 800 but the curves cut off at >200. The weird thing is if I change the class type to TEfficiency they come out fine. I have tried creating the TGraphyAsymmErrors objects two ways:
effPlots.append(ROOT.TGraphAsymmErrors(numHist, denomHist, "cl=0.683 b(1,1) mode"))
and
    effPlots.append(ROOT.TGraphAsymmErrors())
    effPlots[plotnumber].Divide(numHist, denomHist, "cl=0.683 b(1,1) mode")
neither makes a difference.
Here’s how I’m creating the TEfficiency objects:
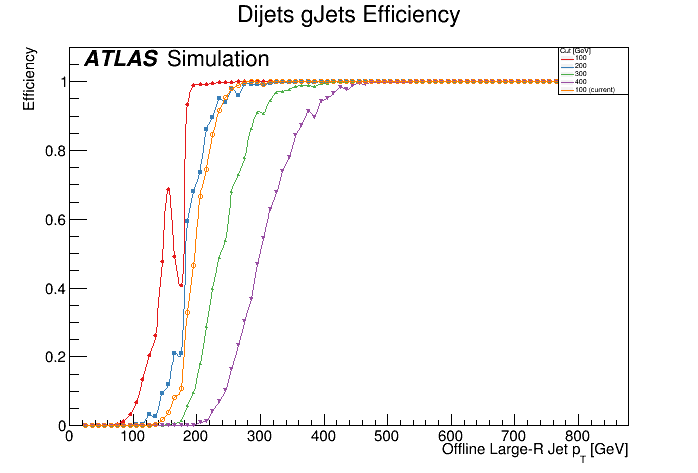
effPlots.append(ROOT.TEfficiency(numHist, denomHist))
The input histograms did not change at all – literally the only thing that changed was the efficiency plot object type.
Here’s the plot with TEfficiency:
Here’s the plot with TGraphAsymmErrors:
Anybody have any idea what this might be? Any help is much appreciated – thanks!!