Now fixed in master:
{
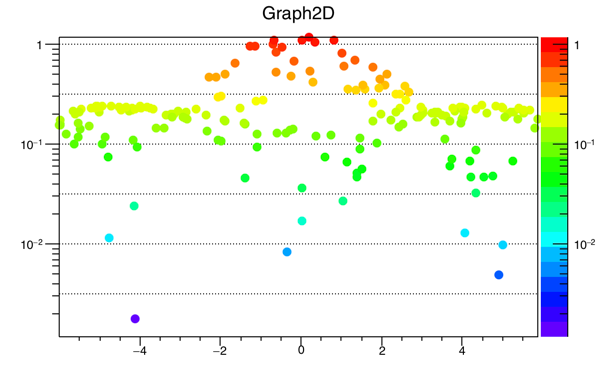
TCanvas *c = new TCanvas("c","Graph2D example",0,0,600,400);
Double_t x, y, z, P = 6.;
Int_t np = 200;
TGraph2D *dt = new TGraph2D();
TRandom *r = new TRandom();
for (Int_t N=0; N<np; N++) {
x = 2*P*(r->Rndm(N))-P;
y = 2*P*(r->Rndm(N))-P;
z = (sin(x)/x)*(sin(y)/y)+0.2;
dt->SetPoint(N,x,y,z);
}
gStyle->SetPalette(1);
gPad->SetLogz();
dt->SetMarkerStyle(20);
dt->Draw("pcolz");
c->SetPhi(0.00001);
c->SetTheta(0.00001);
}