Dear root expert,
In the plot I attached:
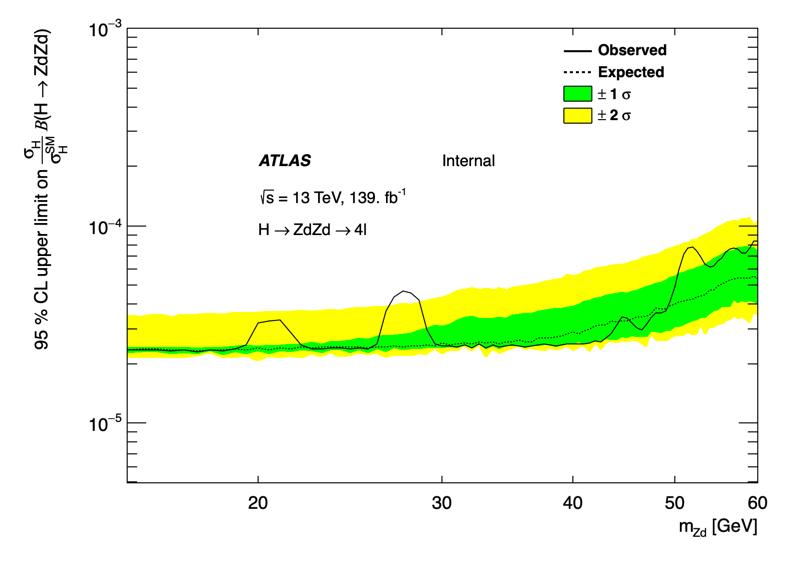
there are “Wiggles” in the bottom part of the 2 sigma band.
I would like to smooth it or use smoothing/rolling average technique, could someone advise please how to proceed?
Here is my code:
#include "Math/Interpolator.h"
#include <iostream>
#include "AtlasStyle.C"
void BRHaalimitSetHigh_mass_fullRun2() {

  TString files_lm[]={"D_MassVsLimit-totXS-ZdZd-HM-50Ktoys-Aug2020"};
  TString files[]={"./KETEVIBrZDmumulist.dat"};
  TString canv[]={"can3"};
  gSystem->Load("AtlasStyle.C");
  SetAtlasStyle();
  std::vector<unsigned int> Npoints {91};
  const unsigned int  Npoints_fix = 1649;
  const unsigned int  Npoints_max = 2000;
  Double_t mzd[Npoints_max];
  Double_t Brall[Npoints_max];
  Double_t ggFSigma[Npoints_max];
  Double_t fac[Npoints_max];
  double mass[Npoints_max];
  double obs[Npoints_max];
  double Exp[Npoints_max];
  double onesiglow[Npoints_max];
  double onesighigh[Npoints_max];
  double twosiglow[Npoints_max];
  double twosighigh[Npoints_max];
  TCanvas *can = new TCanvas(canv[0], canv[0],66,52,800,600);
  can->Range(0,0,1,1);
  can->SetFillColor(0);
  can->SetBorderMode(0);
  can->SetBorderSize(2);
  can->SetFrameBorderMode(0);
  can->SetLogx();
  can->SetLogy();
  TGraphErrors *gre = new TGraphErrors(Npoints_max);
  gre->SetName("CLs_observed");
  gre->SetTitle("Observed CLs");
  gre->SetFillColor(1);
  gre->SetLineColor(1);
  gre->SetLineWidth(2);
  gre->SetMarkerStyle(20);
  TH1F *Graph_CLs_observed1 = new TH1F("Graph_CLs_observed1","",100,15,60);
  Graph_CLs_observed1->SetMaximum(1.0e-3);
  Graph_CLs_observed1->SetMinimum(5.0e-6);
  Graph_CLs_observed1->SetDirectory(0);
  Graph_CLs_observed1->SetStats(0);
  TGaxis *yaxis = (TGaxis*)Graph_CLs_observed1->GetYaxis();
  yaxis->SetMaxDigits(2);
  Int_t ci;   // for color index setting
  Int_t cii;
  ci = TColor::GetColor("#000099");
  Graph_CLs_observed1->SetLineColor(ci);
  Graph_CLs_observed1->GetXaxis()->SetTitle("m_{Zd} [GeV]");// for cross section
  can->Update();
  Graph_CLs_observed1->GetXaxis()->SetLabelFont(42);
  Graph_CLs_observed1->GetXaxis()->SetLabelSize(0.035);
  Graph_CLs_observed1->GetXaxis()->SetTitleSize(0.035);
  Graph_CLs_observed1->GetXaxis()->SetTitleFont(42);
  Graph_CLs_observed1->GetYaxis()->SetTitle("95 % CL upper limit on #frac{#sigma_{H}}{#sigma^{SM}_{H}} #font[12]{B}(H #rightarrow ZdZd)");// for cross section
  Graph_CLs_observed1->GetYaxis()->SetLabelFont(42);
  Graph_CLs_observed1->GetYaxis()->SetLabelSize(0.035);
  Graph_CLs_observed1->GetYaxis()->SetTitleSize(0.035);
  Graph_CLs_observed1->GetYaxis()->SetTitleFont(42);
  Graph_CLs_observed1->GetYaxis()->SetTitleOffset(1.85);
  Graph_CLs_observed1->GetZaxis()->SetLabelFont(42);
  Graph_CLs_observed1->GetZaxis()->SetLabelSize(0.035);
  Graph_CLs_observed1->GetZaxis()->SetTitleSize(0.035);
  Graph_CLs_observed1->GetZaxis()->SetTitleFont(42);
  Graph_CLs_observed1->GetXaxis()->SetMoreLogLabels();
  gre->SetHistogram(Graph_CLs_observed1);
  gre->Draw("al");
  TMultiGraph *multigraph = new TMultiGraph();
  multigraph->SetName("Plot_expected");
  multigraph->SetTitle("Expected Plot");
  for(Int_t i=0;i<1;i++){
    TString tmps;
    ifstream fin_lm(files_lm[i]);
    ifstream fin(files[0]);

    for (Int_t k=0; k<Npoints_fix; k++)
      {
	fin>>tmps;mzd[k]=tmps.IsFloat()?tmps.Atof():0;fin>>tmps; Brall[k]=tmps.IsFloat()?tmps.Atof():0;

	}
    ROOT::Math::Interpolator inter(1649, ROOT::Math::Interpolation::kCSPLINE);
    inter.SetData(1649, mzd, Brall);
    double invCrossSection = (1.0 / 48.59)*0.001;// for cross section
    for (Int_t j=0; j<Npoints[i]; j++)
      {
	//#Mass 	 Obs 	 Exp 	 -1sigma 	 +1sigma 	 -2sigma 	 +2sigma
	fin_lm>>tmps;mass[j]=tmps.IsFloat()?tmps.Atof():0;
	fin_lm>>tmps; obs[j]=tmps.IsFloat()?tmps.Atof():0;
	fin_lm>>tmps; Exp[j]=tmps.IsFloat()?tmps.Atof():0;
	fin_lm>>tmps; onesiglow[j]=tmps.IsFloat()?tmps.Atof():0;
	fin_lm>>tmps; onesighigh[j]=tmps.IsFloat()?tmps.Atof():0;
	fin_lm>>tmps; twosiglow[j]=tmps.IsFloat()?tmps.Atof():0;
	fin_lm>>tmps; twosighigh[j]=tmps.IsFloat()?tmps.Atof():0;


	double interBr = inter.Eval( mass[j] );
	fac[j] =  invCrossSection/ (4*interBr*interBr);// or interBr*interBr + 2*interBr*interBr + interBr*interB
	ggFSigma[j] = fac[j];
      }

    TGraphAsymmErrors *grae = new TGraphAsymmErrors(Npoints[i]);
    grae->SetName("sig2");
    grae->SetTitle("Expected CLs #pm 2 #sigma");
    grae->SetFillColor(kYellow);
    for ( Int_t j=0; j<Npoints[i]; j++) {
      grae->SetPoint(j,mass[j],Exp[j]*(ggFSigma[j]));
      grae->SetPointError(j,0,0,Exp[j]*(ggFSigma[j])-twosiglow[j]*(ggFSigma[j]),twosighigh[j]*(ggFSigma[j])-Exp[j]*(ggFSigma[j]));
    }
    multigraph->Add(grae,"4");
    grae = new TGraphAsymmErrors(Npoints[i]);
    grae->SetName("sig1");
    grae->SetTitle("Expected CLs #pm 1 #sigma");
    grae->SetFillColor(kGreen);
    for ( Int_t j=0; j<Npoints[i]; j++ )
      {
	grae->SetPoint(j,mass[j],Exp[j]*(ggFSigma[j]));
	grae->SetPointError(j,0,0,Exp[j]*(ggFSigma[j])-onesiglow[j]*(ggFSigma[j]),onesighigh[j]*(ggFSigma[j])-Exp[j]*(ggFSigma[j]));
      }
    multigraph->Add(grae,"3");
    TGraph *graph = new TGraph(Npoints[i]);
    graph->SetName("");
    graph->SetTitle("Expected CLs - Median");
    graph->SetFillColor(1);
    graph->SetLineColor(1);
    graph->SetLineStyle(2);
    graph->SetLineWidth(2);
    graph->SetLineColor(1);

    for (Int_t j=0; j<Npoints[i]; j++) {
      graph->SetPoint(j,mass[j],Exp[j]*(ggFSigma[j]));
    }
    multigraph->Add(graph,"L");
    gre = new TGraphErrors(Npoints[i]);
    gre->SetName("CLs_observed");
    gre->SetTitle("Observed CLs");
    gre->SetFillColor(1);
    gre->SetLineColor(1);
    gre->SetLineWidth(2);// for kappa
    gre->SetMarkerStyle(20);
    gre->SetFillStyle(3004);
    gre->SetLineColor(1);

    for ( Int_t j=0; j<Npoints[i]; j++) {
      gre->SetPoint(j,mass[j],obs[j]*(ggFSigma[j]));
      gre->SetPointError(j,0,0);
    }
    multigraph->Add(gre,"l");
    multigraph->Draw("");
  }
  TLegend *leg = new TLegend(0.7,0.78,0.9,0.93,NULL,"brNDC");
  leg->SetBorderSize(0);
  //leg->SetLineColor(1);
  leg->SetLineStyle(1);
  leg->SetLineWidth(1);
  // leg->SetFillColor(19);
  leg->SetFillStyle(1001);

  TLegendEntry * entry=leg->AddEntry("CLs_observed","Observed","L");
  entry->SetLineColor(1);
  entry->SetLineStyle(2);
  entry->SetLineWidth(2);
  entry->SetMarkerColor(1);
  entry->SetMarkerStyle(20);
  entry->SetMarkerSize(1);

  entry=leg->AddEntry("Plot_expected","Expected","l");
  entry->SetLineColor(1);
  entry->SetLineStyle(2);
  entry->SetLineWidth(2);
  entry->SetMarkerColor(1);
  entry->SetMarkerStyle(21);
  entry->SetMarkerSize(1);


  entry=leg->AddEntry("sig1","#pm 1 #sigma","F");
  entry=leg->AddEntry("sig2","#pm 2 #sigma","F");
  leg->Draw();
  gPad->RedrawAxis();
  leg->Draw();
  TLatex *tex = new TLatex();
  tex->SetTextFont(72);
  tex->SetTextSize(0.03);
  tex->DrawLatex(20,2e-4,"ATLAS");
  tex->SetTextFont(42);
  tex->SetTextSize(0.03);
  tex->DrawLatex(30,2e-4,"Internal");
  tex->DrawLatex(20,1.3e-4,"#sqrt{s} = 13 TeV, 139. fb^{-1}");
  tex->DrawLatex(20,.9e-4,"H #rightarrow ZdZd #rightarrow 4l");
}
you can run the code by doing: root -l BRHaalimitSetHigh_mass_fullRun2.C
The input file you need to run the code are put on dropbox: https://www.dropbox.com/s/qnkm2c12f217te7/inputForRootForum.zip?dl=0
Thanks in advance.
_ROOT Version:ROOT 6.18/04
macosx64