I’ve noticed an issue plotting TGraph object with a large number of points in jsROOT. When using the "L" option the line does not connect all the points, but instead picks every nth point to connect.
Using this python code in a juypter notebook:
import numpy as np
import ROOT
ROOT.enableJSVis()

num_points = 250000
x = np.arange(num_points, dtype='float64')
y = np.random.randn(num_points)

g = ROOT.TGraph(num_points, x, y)
g.Draw("ALP")
ROOT.gPad.Draw()
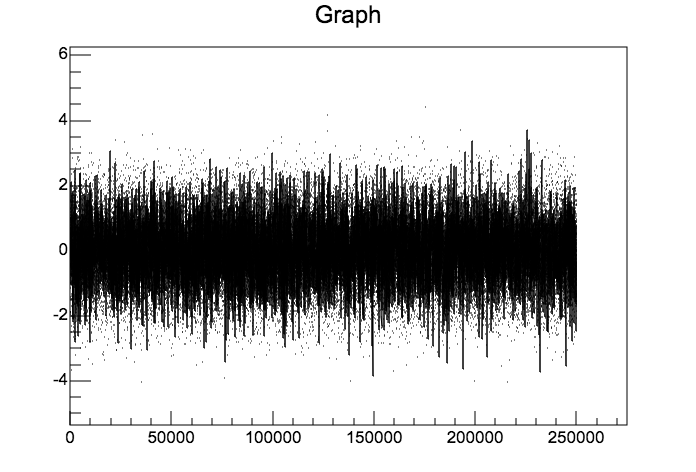
generates the following image, where it is clear there are points that are not connected by a line. In fact the line only connects every 50th point.
It is a feature. By default up to 5000 points are used when drawing lines and up to 50000 points when drawing markers. This is inconsistent and I will fix it.
50,000 points will still not enough for the figures I’m producing.
I need redo some performance measurements - SVG graphics can be very slow when creating too much primitives. From other side, now JSROOT creates very few primitives even when drawing large number of markers or points.
Is there, or will there be, some control over this?
In JSROOT itself one could disable graphics optimization, but one cannot change it in juypter notebooks. I will try to provide reasonable solution.
I check performance with my actual browser - it is now much better.
Therefore drawing of many points or many lines should not be a problem.
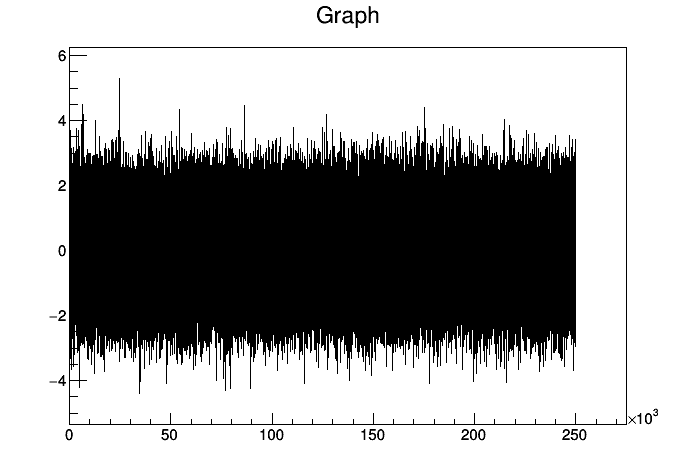
With current developer version I can draw 250000 points easily:
This version will be release until end of the year and then will be used for iPython Notebooks.
For the time been you could try to use TH1 class - it should work better in JSROOT.
Even with very large number of bins it should draw complete dynamic range properly.