I am fitting a custom function to four TGraphErrors. All fits are ‘complete’ - they return accurate parameters - but are not displayed on the pad. In fact, they are displayed as single flat lines at the top of the pad (completely outside the graph). I can change the colour of this fitted line, even. I can select this line by moving my mouse over where the lfitted function ‘should’ be.
On a separate canvas I can draw these fit functions and they appear properly. Trying to ‘redraw’ these functions overtop of the graph data only results in another line at the top of the pad.
Of the four, a single graph displays its fit. When I input the ‘working’ X-axis data into the other pads, they fit properly as well. I have no problem displaying any other component of my graphs. The data of the other graphs are only marginally different from the working data - altered by a small correction.
The code collecting the corrected data is somewhat long but I will provide it if my description hasn’t provided enough information to solve the problem.
Thank you very much for your time and assistance, it’s greatly appreciated.
-Stef Simmons
I’ve attached the file, as well as the ROOT file I am working with for it to run. I must admit that I’m already suspicious of this code, as I can only get it working the way I would like with a fresh ROOT session every time.
My version of root is 4.04/02.
Please let me know if you have any further questions. Thank you again for your help.
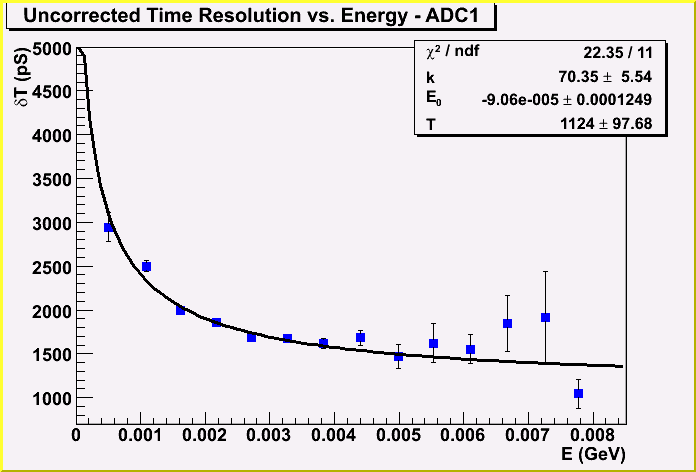
My script produced two separate canvases - both ADC1 and ADC2. ADC1 was the one working canvas and I provided that for comparison, however ADC2 illustrated the problem I was having.
If ADC2 displys just as beautifully as your attached ADC1, I apologize for wasting your time. If so, I have one question for you: Where should I look internally to locate this problem?
In your function TimeResEnergy (x[0]-par[1]) can be <= 0
You should protect this case to avoid a negative sqrt.
You should also restrict the fit range for timeGraph2 to eg [1e-3,1e-2]