---- Update >>>
Mmmh… reading some more in RootTalk, it looks like TGaxis cannot be used to do what I want (below). That’s too bad. I should have guessed that, since the boundaries specified in the function are not related to “x” really. I would appreciate another solution, other than the brute force method of creating the scale using lines (which isn’t so bad in this case)!
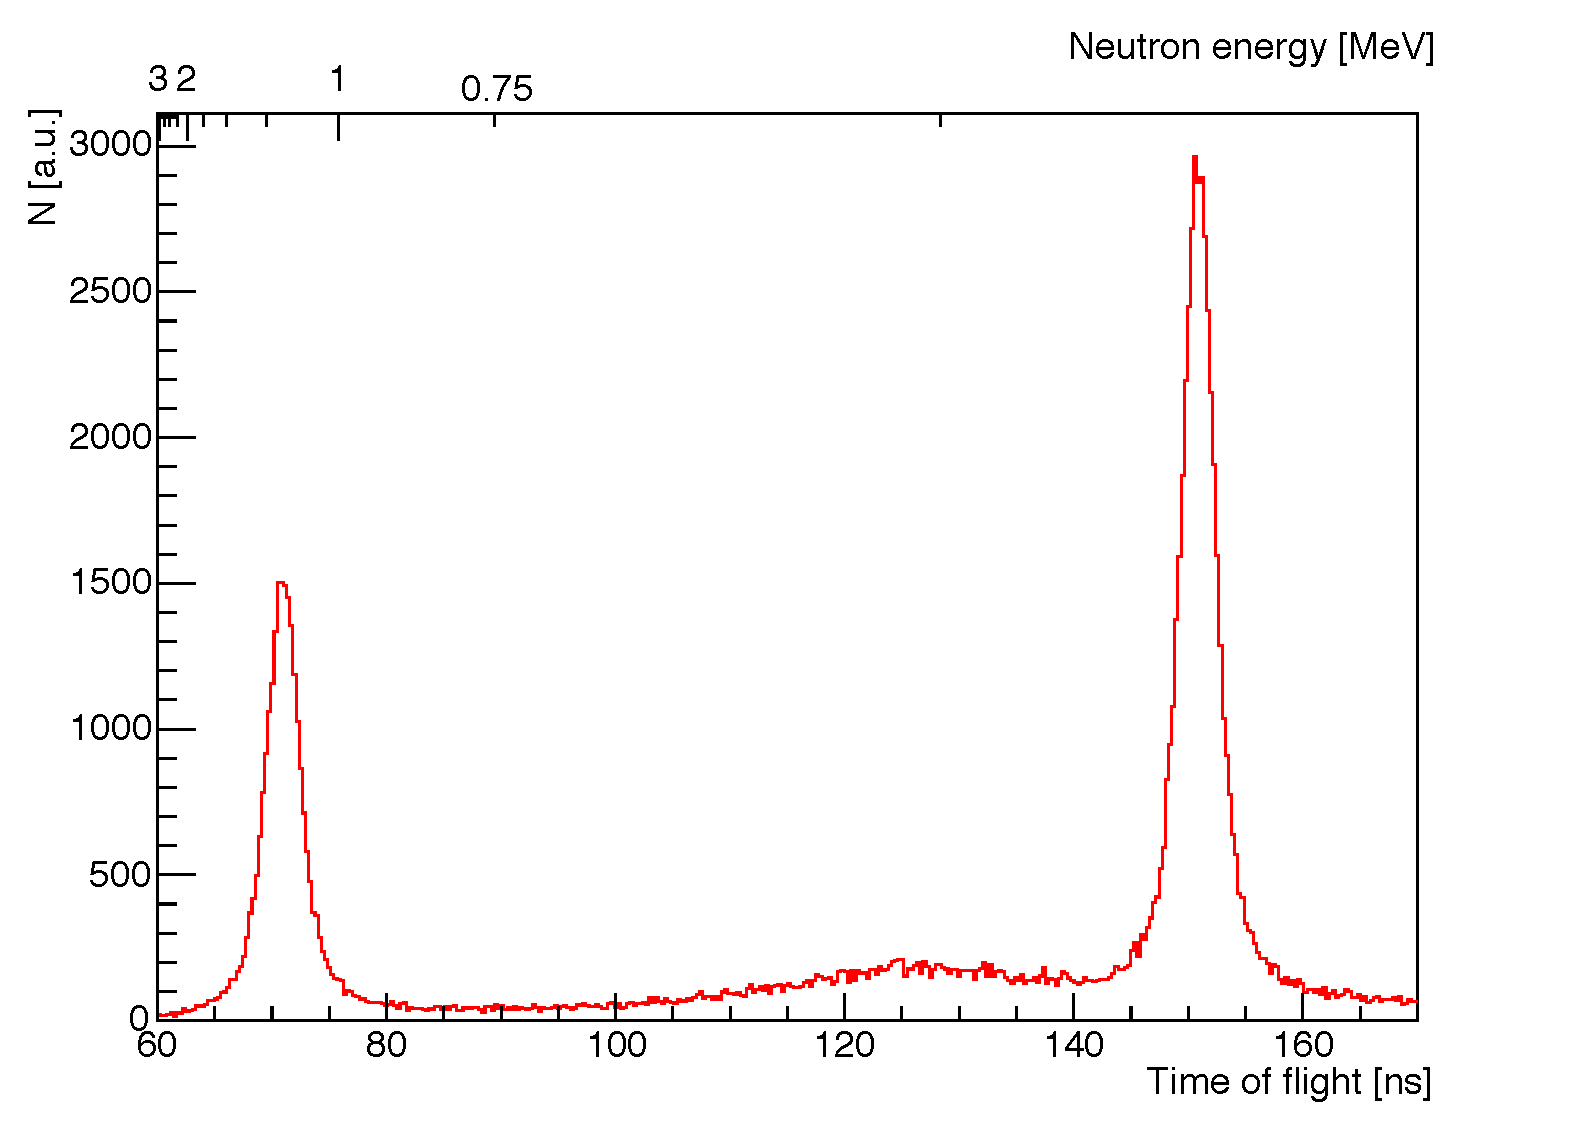
Hello, I want to plot a TOF spectrum and show the equivalent neutron energy on an other horizontal axis. I figured out how to do this, but I am puzzled by the result. Despite the fact that I specify the function to be:
TF1 *f1 = new TF1("f1","11448.727/(TMath::Power(x,2))",0.39615,3.1802);with 0.39… MeV and 3.18… MeV being the boundaries corresponding to 170ns and 60ns respectively.
The behavior I get does not correspond to that function. The peak on the left (picture attached) is located around 72ns, which according to my function should line up with 2.21 MeV or so. That’s not what I observe. Also, if I change “11448.727” to something else (10x smaller for example), it doesn’t change the scale. Am I missing something about the way the custom function works? For reference, here is the TGaxis part:
TGaxis *axis2 = new TGaxis(c_TOF->GetUxmin(),c_TOF->GetUymax(),c_TOF->GetUxmax(),c_TOF->GetUymax(),"f1",505,"-"); Thanks for your help!