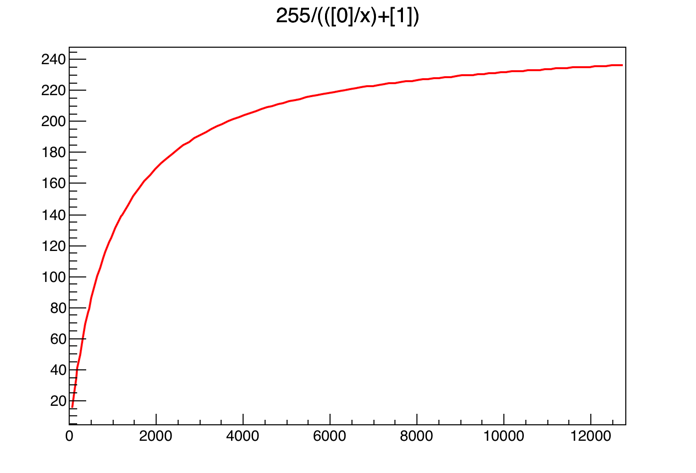
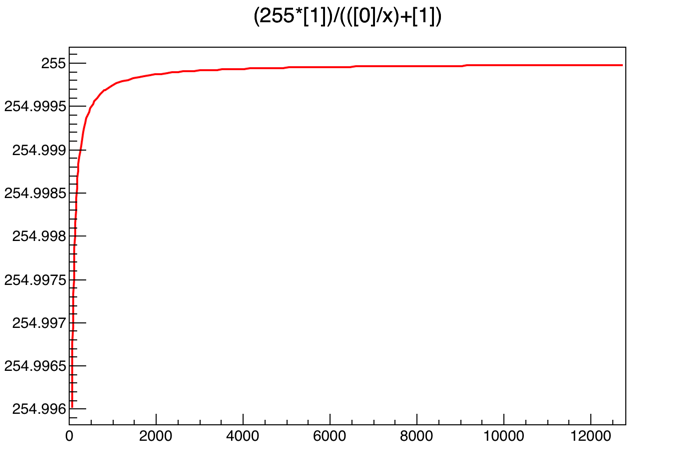
Why do the two following function plots are different? The only difference is that in the first one, I add parameter number 1 in the numerator of my function, but it is set to one, so it should have no effect. However, the resulting functions are clearly different. I’m using ROOT 6.03/04 on MacOSX 10.10.4, installed from source.
import ROOT

f = ROOT.TF1('f', '(255*[1])/(([0]/x)+[1])', 0, 12800)
f.SetParameter(0, 1000)
f.SetParameter(1, 1.0)

canvas = ROOT.TCanvas()
f.Draw('C')
canvas.Print('test1.png')


f = ROOT.TF1('f', '255/(([0]/x)+[1])', 0, 12800)
f.SetParameter(0, 1000)
f.SetParameter(1, 1.0)

canvas = ROOT.TCanvas()
f.Draw('C')
canvas.Print('test2.png')