Please fill also the fields below. Note that root -b -q will tell you this info, and starting from 6.28/06 upwards, you can call .forum bug from the ROOT prompt to pre-populate a topic.
ROOT Version: 6.28.10 Platform: ubuntu 22.04 Compiler: c++ 11.4.0
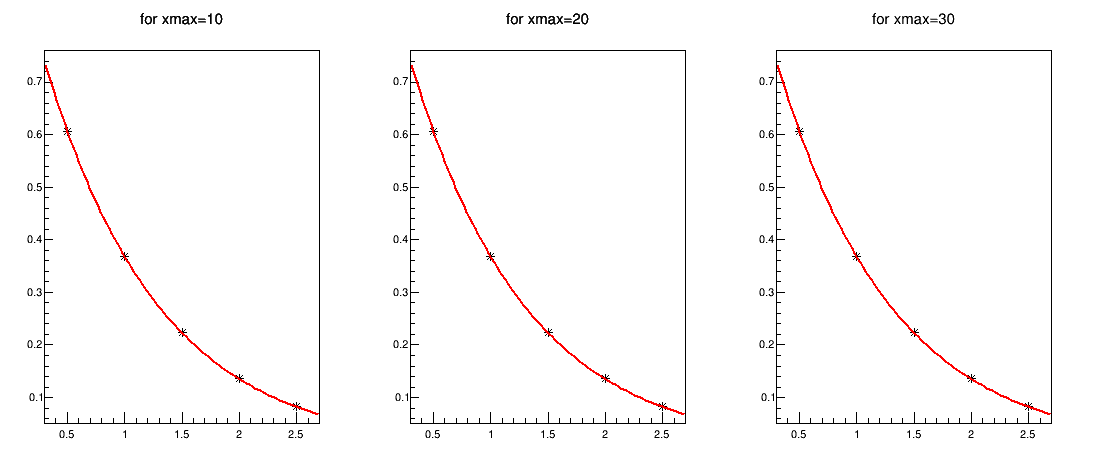
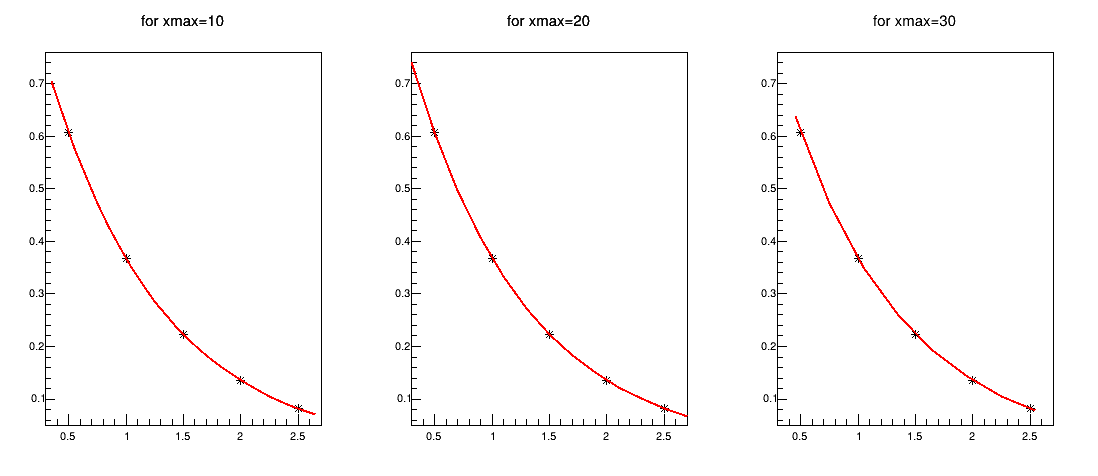
For ROOT versions > 6.28.10 I encountered an issue/bug when plotting a TF1 in a smaller x-range than the x-ranges where it is defined. The attached small code and 2 plots show the issue for the simple exponential function. The function is defined in three x-ranges (from x=0 to xmax = 10, 20 and 30). First I draw a graph defined in a small x-range then draw the function with the option “same” (alternatively one can draw the TF1 in a small x-range by using TF1::GetXaxis()->SetRangeUser without using a graph). The attached 1st plot, obtained for ROOT v6.28.10, shows the same result for different xmax, as expected. The 2nd plot , obtained for ROOT v6.32.24, shows different results for different xmax. The issue is more pronounced for more complex functions , e.g. for BesselK1.
Increase the number of points in x where the TF1 are drawn, e.g. to 500 (f1->SetNpx(500); etc), so that there are enough points in the small range you are plotting them.
I don’t know, maybe a ROOT developer or someone familiar with the change can tell. The code for SetNpx hasn’t changed in many versions (you can choose other versions in a dropdown menu at the top of the Reference page I linked), and the Release Notes for the 6.28.xx series don’t mention this change in behaviour (at least not explicitly), so maybe I missed it (didn’t read all details of all changes) or it could be a side effect of another change somewhere else (TGaxis? etc.).