Text on x-axis instead of numbers

Hello, I need to write a text on x-axis of a Tmulti-graph (i.e. a text instead of numbers).
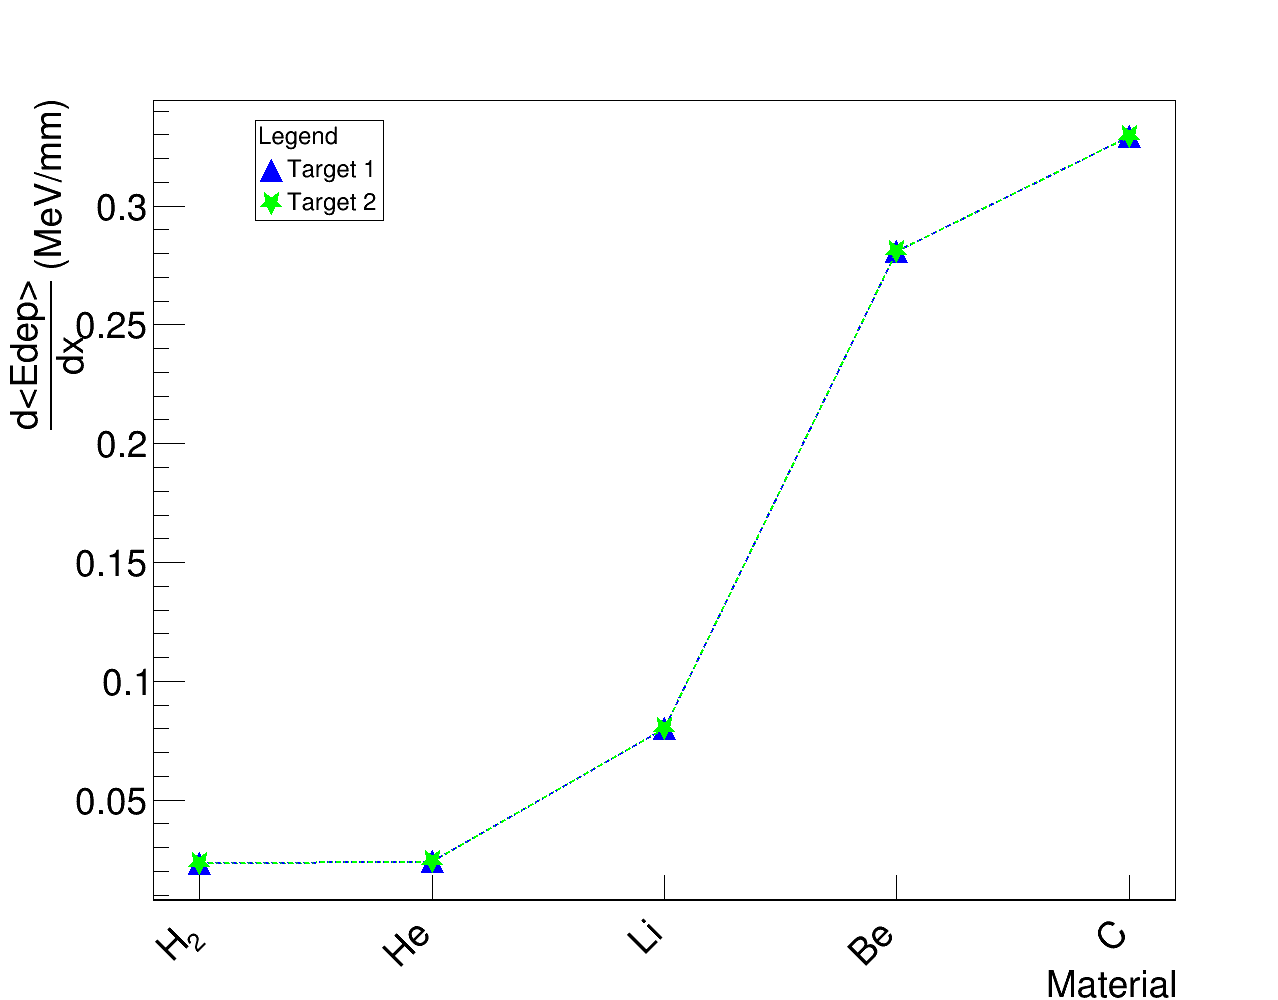
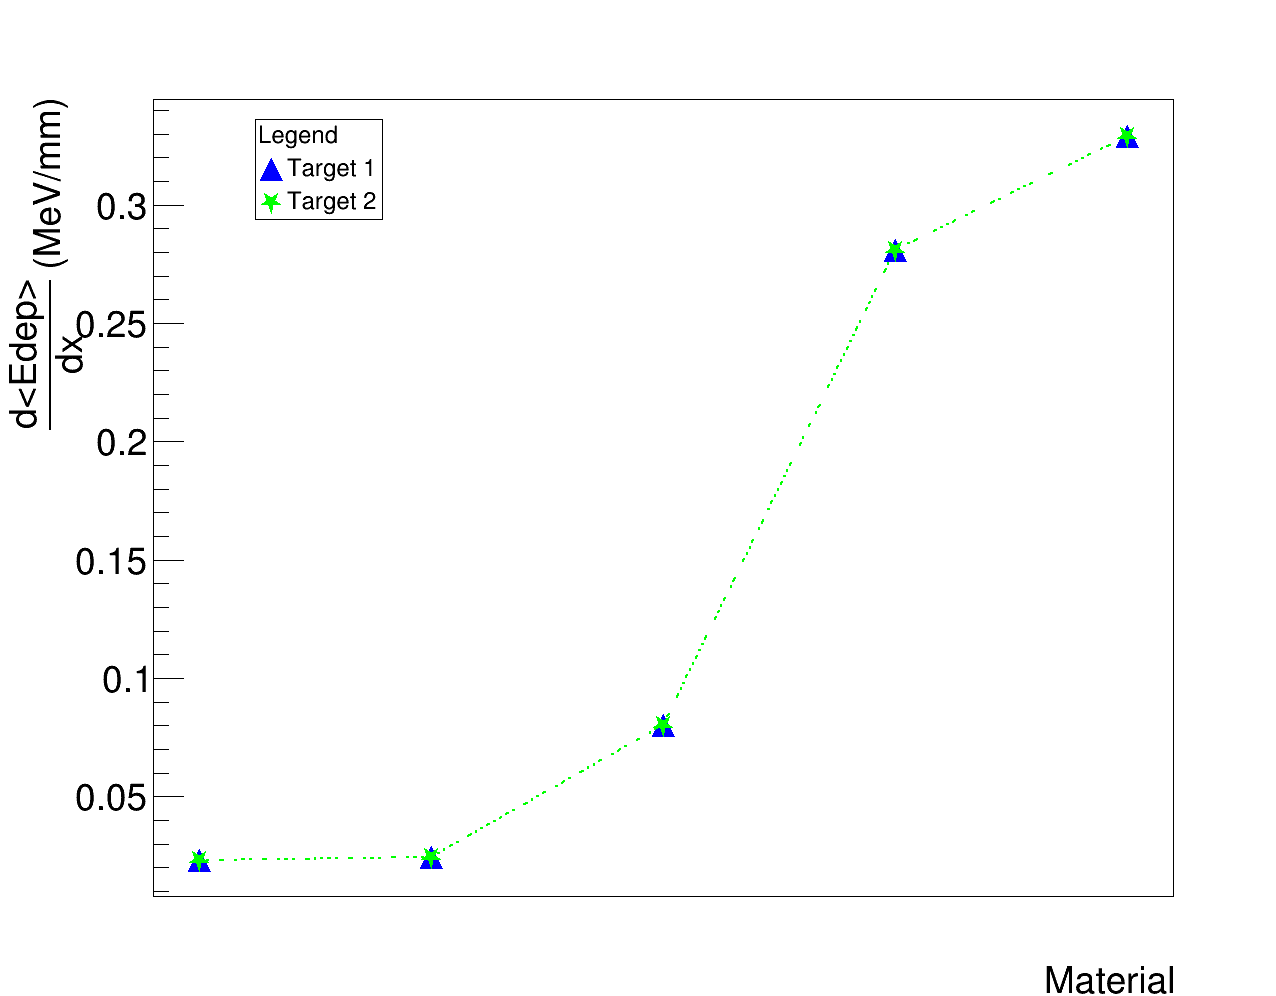
I mean…I’m plotting the energy loss for unit of thickness in several mulit-target materials (H, He, Li, Be, C) therefore I want the chemical symbols on the x-axis instead of number (1,2,3,4,5)
I wrote the macro using

 mg->GetHistogram()->GetXaxis()->SetBinLabel(bin1,"H_{2}");
   gPad->Update();
     mg->GetXaxis()->ChangeLabel(bin1, 45, 0.02, 31, -1, -1,Form("H_{2}"));
     gPad->Update();
     mg->GetXaxis()->ChangeLabel(bin2, 45, 0.02, 31, -1, -1,Form("He"));
     gPad->Update();
     mg->GetXaxis()->ChangeLabel(bin3, 45, 0.02, 31, -1, -1,Form("Li"));
      gPad->Update();
     mg->GetXaxis()->ChangeLabel(bin4, 45, 0.02, 31, -1, -1,Form("Be"));
     gPad->Update();
     mg->GetXaxis()->ChangeLabel(bin5, 45, 0.02, 31, -1, -1,Form("C"));

but I get empty x-axis

Here macro and data files
dedxmat.cpp (3.1 KB)
Edep_dx_materials_tar01.txt (117 Bytes)
Edep_dx_materials_tar02.txt (112 Bytes)

Thank you and happy 2022!


Please read tips for efficient and successful posting and posting code

ROOT Version: Not Provided
Platform: Not Provided
Compiler: Not Provided


Check out how ChangeLabel works:
https://root.cern/doc/master/classTAxis.html#afc19787e727c9e3c85be72eba03338da
You first have

mg->GetXaxis()->SetLabelSize(40);

but then you do

mg->GetXaxis()->ChangeLabel(bin1, 45, 0.02, 31, -1, -1,Form("H_{2}"));

So, use a larger size in ChangeLabel, or -1 to keep it as-is.
Also:
1 - For ChangeLabel, the first argument is not bin number, but label number. So in your case, use SetNdivisions(5) (not 6!) and then they are 1,2,…5.
2 - remove all those gPad->Update(); lines, you can use just these (at the end):

    c01->Modified();
    c01->Update();

E.g.

   mg->SetTitle("");
   mg->GetXaxis()->SetTitle("Material");
   mg->GetYaxis()->SetTitle("#frac{d<Edep>}{dx} (MeV/mm)");
   mg->GetYaxis()->SetTitleOffset(offy);
   mg->GetXaxis()->SetTitleOffset(offx);
   mg->GetYaxis()->SetTitleSize(40);
   mg->GetYaxis()->SetTitleFont(43);
   mg->GetYaxis()->SetLabelFont(43);
   mg->GetYaxis()->SetLabelSize(40);
   mg->GetXaxis()->SetTitleSize(40);
   mg->GetXaxis()->SetTitleFont(43);
   mg->GetXaxis()->SetLabelFont(43);
   mg->GetXaxis()->SetLabelSize(40);
   mg->GetXaxis()->SetNdivisions(5);
   mg->Draw("ALP");
   TLegend* leg = new TLegend(0.2, 0.78, .3, .88);
   leg->SetHeader("Legend");
   leg->SetNColumns(1);
   leg->AddEntry(graph1, "Target 1", "ap");
   leg->AddEntry(graph2, "Target 2", "ap");
   leg->Draw();
   mg->GetXaxis()->ChangeLabel(1, 45, -1, 31, -1, -1,Form("H_{2}"));
   mg->GetXaxis()->ChangeLabel(2, 45, -1, 31, -1, -1,Form("He"));
   mg->GetXaxis()->ChangeLabel(3, 45, -1, 31, -1, -1,Form("Li"));
   mg->GetXaxis()->ChangeLabel(4, 45, -1, 31, -1, -1,Form("Be"));
   mg->GetXaxis()->ChangeLabel(5, 45, -1, 31, -1, -1,Form("C"));
   c01->Modified();
   c01->Update();

1 Like

Thank you @dastudillo !

This topic was automatically closed 14 days after the last reply. New replies are no longer allowed.